How to Create Screeners 🧵🧵
1) Golden Cross
2) Bounced from 200 EMA
3) EMA Confluence
4) Higher High
5) High Volume
6) Narrow Range
7) Microcaps with sales 🔼
8) Dividend stocks
9) Penny with sales 🔼
10) High Promoter stake
Explained in this thread
Kindly Retweet Like 🙏 twitter.com/i/web/status/1…
1) Golden Cross
2) Bounced from 200 EMA
3) EMA Confluence
4) Higher High
5) High Volume
6) Narrow Range
7) Microcaps with sales 🔼
8) Dividend stocks
9) Penny with sales 🔼
10) High Promoter stake
Explained in this thread
Kindly Retweet Like 🙏 twitter.com/i/web/status/1…
First of All click Create Scan on Chart Ink and start by clicking that + sign
First Basic Screener ( Technical ) -
1) Golden Crossover - 50 EMA Crossing 100
Only one Condition -
Latest close ( EMA 50 ) Crosses above EMA 100
First Basic Screener ( Technical ) -
1) Golden Crossover - 50 EMA Crossing 100
Only one Condition -
Latest close ( EMA 50 ) Crosses above EMA 100

2) Stocks that Bounce from 200 EMA or near 200 EMA
Condition -
Latest Low is < 200 EMA
Latest close is > 200 EMA
Means it went below 200 EMA but closed above that
Condition -
Latest Low is < 200 EMA
Latest close is > 200 EMA
Means it went below 200 EMA but closed above that

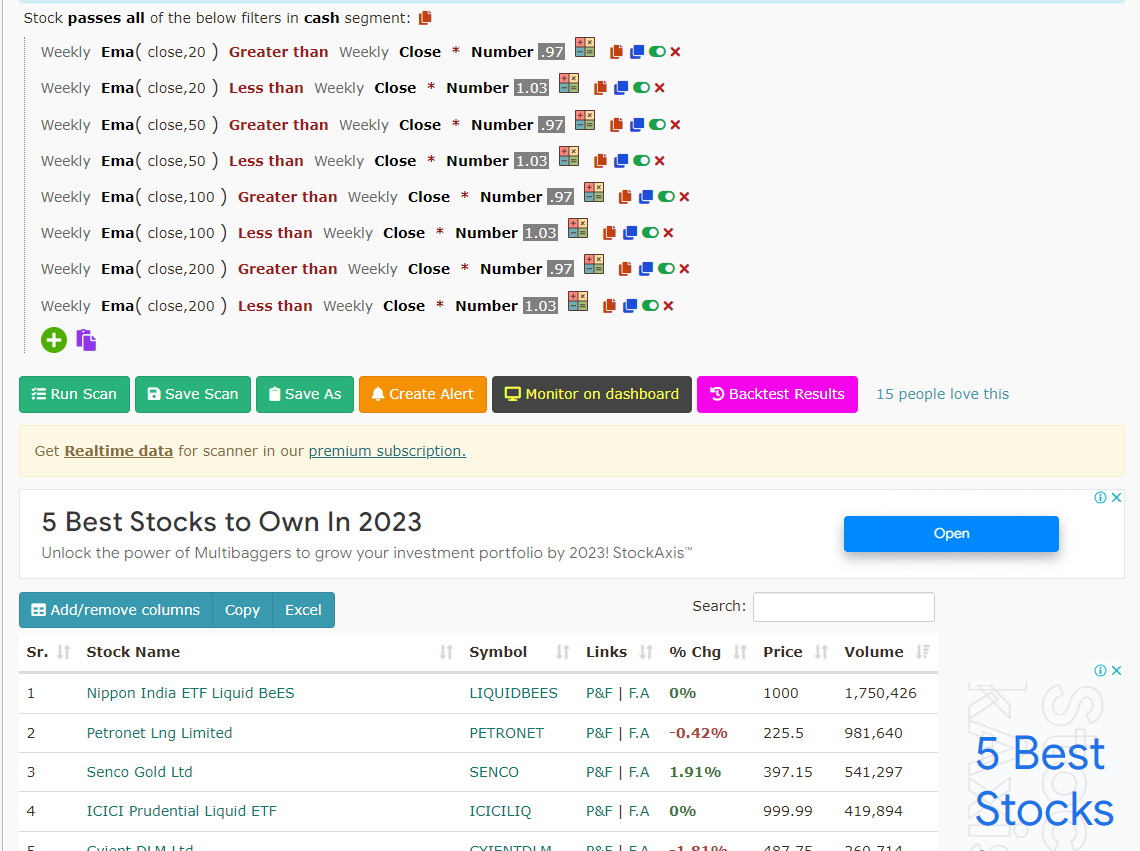
3) 20-50-100 EMA Confluence
Confluence generally decide the move, R:R is always best when you trade at EMA Confluence
Conditions - All EMAs must have close value
Confluence generally decide the move, R:R is always best when you trade at EMA Confluence
Conditions - All EMAs must have close value
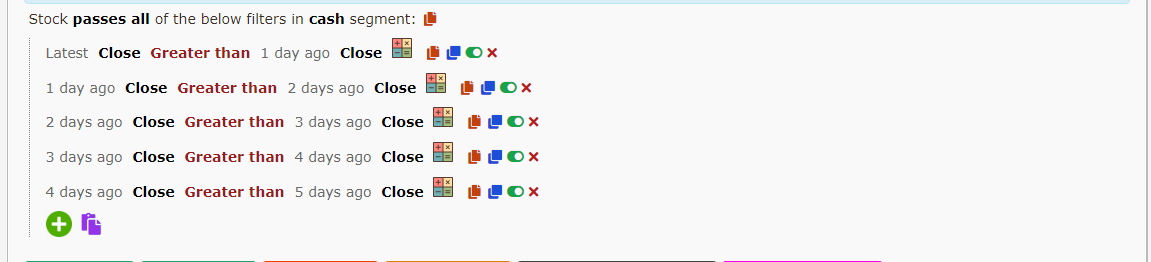
4) Stocks making higher high everyday -
Condition - latest day high > previous day high
Condition - latest day high > previous day high
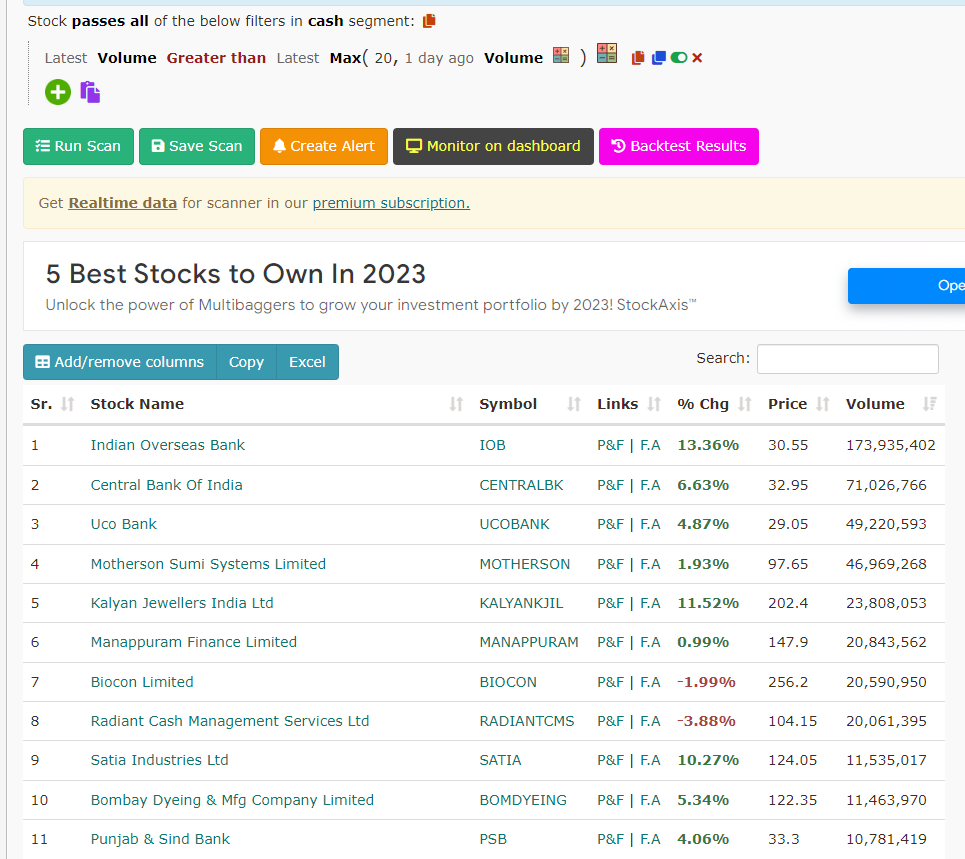
5) Volume Blast -
When Volume is greater than last 20 days here -
Modify according to requirement
Max Function used means volume latest is greater than max volume of last 20 days
When Volume is greater than last 20 days here -
Modify according to requirement
Max Function used means volume latest is greater than max volume of last 20 days
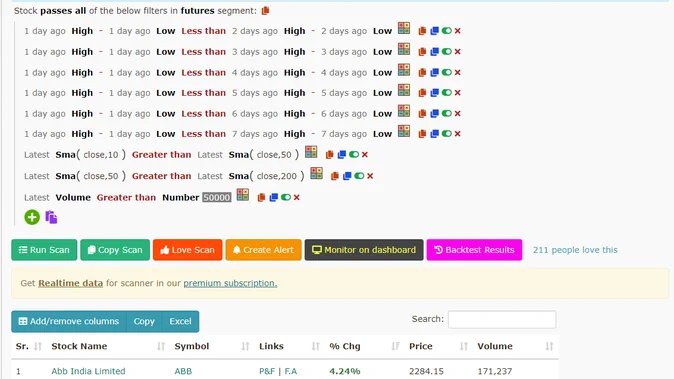
6) Stocks with narrowing Range
Means Big Move is Near
Condition - Everyday difference between high and low must be less than previous day diff
Diff of High Low Today < Diff of High Low Yesterday
and So on for number of days you want
Means Big Move is Near
Condition - Everyday difference between high and low must be less than previous day diff
Diff of High Low Today < Diff of High Low Yesterday
and So on for number of days you want
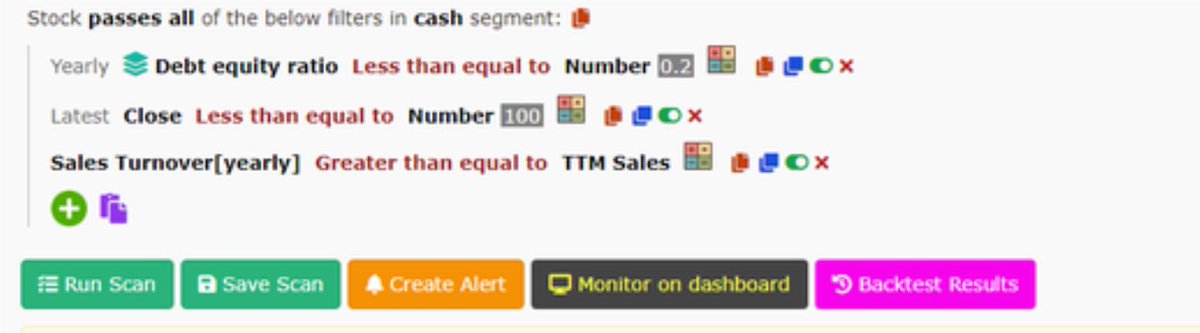
7) Stocks UNDER 100 with low Debt and Rising Sales
Conditions -
1) D/E Ratio < 0.2 ( change according to you )
2) Price < 100
3) Current year sales more than last year
Conditions -
1) D/E Ratio < 0.2 ( change according to you )
2) Price < 100
3) Current year sales more than last year
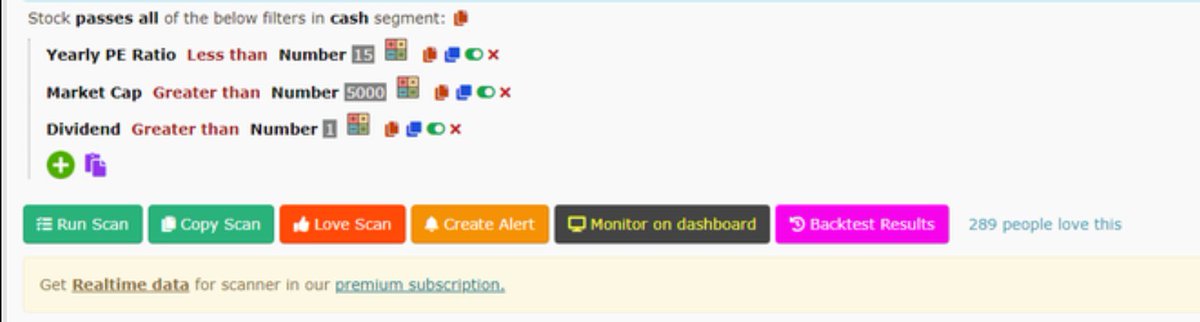
8) Good Dividend Paying Stocks which can grow
Conditions -
1) Dividend > 1
2) PE Ratio < 15
3) Mcap > 5000
Change conditions according to your research -
Conditions -
1) Dividend > 1
2) PE Ratio < 15
3) Mcap > 5000
Change conditions according to your research -
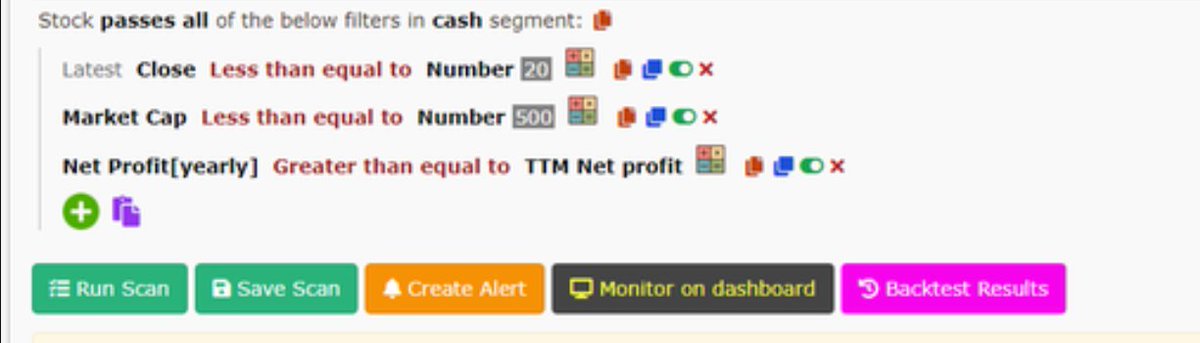
9) Penny Stocks Rising Profits -
Conditions -
1) Price < 20
2) Mcap < 500 Cr
3) Rising Profits ( one can compare for many years )
Conditions -
1) Price < 20
2) Mcap < 500 Cr
3) Rising Profits ( one can compare for many years )
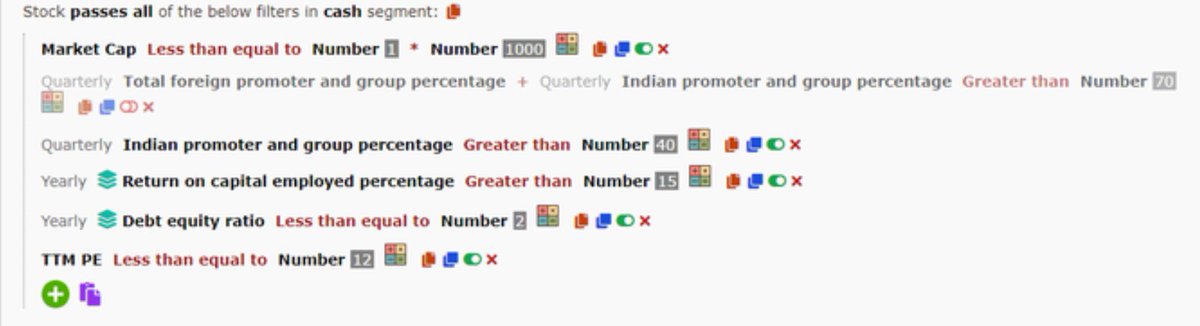
10) High Promoter Stake Good Roce low PE Conditions given in screeners
This is how you all can create screeners according to your research and strategy 🙏
Please follow my handle @myfirststock99
for more such info
Do join telegram - t.me/TradeTheTrend_…
Please follow my handle @myfirststock99
for more such info
Do join telegram - t.me/TradeTheTrend_…
• • •
Missing some Tweet in this thread? You can try to
force a refresh