Jeff Gilchrist Profile picture
Dec 3 26 tweets 8 min read Twitter logo Read on Twitter
Why do people seem to be getting sick more often now?

For yet another year we are already seeing earlier and significantly higher hospital admissions for respiratory illness than pre-pandemic levels. Are there new mysterious pathogens starting to attack us now? 🧵1/ Graphic of a person's body with a target on their chest and a COVID-19 arrow sticking in the bullseye, depicting an artistic representation of immune dysfunction. Prompt: "Create a graphic of immune dysfunction" by Microsoft Copilot.
Now that the excuses of lockdowns are starting to run out after 3 years, even the mainstream media are starting to understand and report what is going on ( ). H/T: @MeetJess 2/goodmorningamerica.com/wellness/video…
Dr Darien Sutton explains that the WHO and CDC are confirming the pathogens that are causing these increases in illness worldwide are not new but the usual suspects of RSV, COVID, adenovirus, strep pneumoniae and other bacteria including mycoplasma. 3/
But why are we seeing higher levels than normal the past few years? He states, “We now have evidence that COVID decreases our immune response, making us more susceptible to infections.” 4/ Photo of Dr Darien Sutton explaining why there are increased hospitalizations on Good Morning America. Image from: https://www.goodmorningamerica.com/wellness/video/cases-respiratory-illnesses-rise-105328220
We are seeing this here in Ontario as well, not just for young children but every age group is higher than historical pre-pandemic levels and those age 65+ are almost off the charts higher ( ). 5/
Secondary infections after being infected with a virus are not new and many studies have shown that people are at higher risk for other infections like bacteria after viral infections like influenza as well. 6/
It is not good for humans to be constantly exposed to dangerous pathogens as you can clearly see how life expectancy more than doubled when we putting mitigations in place to prevent regular exposure and protect from many pathogens like cholera ( ). 7/ ourworldindata.org/grapher/life-e…
Graph showing the period of life expectancy at birth, in a given year for the entire World and breakdown by continental region. Image from: https://ourworldindata.org/grapher/life-expectancy
If you look at the far right of the graph you can see that life expectancy has actually started to go down now world wide due to the pandemic. 8/
Statistics Canada's data is showing similar trends ( ) and the breakdown by province shows that some are more impacted than others. 9/ www150.statcan.gc.ca/t1/tbl1/en/tv.…
Graph showing life expectancy at birth dropping significantly in Canada by province after the pandemic started. Graph from: https://www.datawrapper.de/_/TtAnd/?v=2 using data from https://www150.statcan.gc.ca/t1/tbl1/en/tv.action?pid=1310083701
While many have been blaming lockdowns, studies have been coming out for years now showing how even mild COVID infections can impact the immune system which you need to fight off other pathogens. 10/
A recent study in the USA found "COVID-19 was associated with a significantly increased risk for RSV infections among children aged 0–5 years in 2022." which was also replicated and the same conclusion for kids in 2021 ( ). 11/ncbi.nlm.nih.gov/pmc/articles/P…
Kids 0-5 who had prior COVID infection were 40% higher risk of getting RSV that needed medical attention compared to those who didn't in 2022 and 32% higher in 2021. 12/ Graph showing Increased Risk for Kids with prior COVID Infection of Medically attended RSV infections and Bronchiolitis. Data from: https://www.ncbi.nlm.nih.gov/pmc/articles/PMC10582888/
Kids with prior COVID infection were also at significantly higher risk for bronchiolitis both from RSV and from other causes as shown in the graph. 13/ Graph showing Increased Risk for Kids with prior COVID Infection of Medically attended RSV infections and Bronchiolitis. Data from: https://www.ncbi.nlm.nih.gov/pmc/articles/PMC10582888/
"Our findings suggest that COVID-19 contributed to the 2022 surge of RSV cases in young children through the large buildup of COVID-19-infected children and the potential long-term adverse effects of COVID-19 on the immune and respiratory system." 14/
Why might that be the case? Just one example of potential impact is that multiple studies have shown COVID infection can impair the function of and reduce the numbers of immune dendritic cells even 7 months after infection ( ). 15/
Why is that important? It turns out that dendritic cells are important in starting the immune response to RSV infection and help determine the impact on the adaptive immune response ( ). 16/
A lot of new information has come out over the past year and Dr. Lisa Iannattone has put together a new thread highlighting some of these studies to help you better understand ( ). 17/
A year ago I put together a long thread highlighting a multitude of studies which found some kind of impact from COVID infection on the immune system that still apply today which you can find here ( ). 18/
While your immune system was designed to fight different pathogens, exposure does come at a cost and some damage to your body. 19/
Read these threads to learn what actually happens inside your body when you are sick, part 1 ( ) and part 2 ( ) summary of this video ( ). 20/

Just like our ancestors started putting measures in place to reduce exposure to waterborne pathogens like cholera with sewage treatment and treating water to ensure it is safe to drink, we need to start doing the same for airborne pathogens. 21/
To help turn those life expectancy rates around and start increasing again it is imperative that people understand the importance of indoor air quality ( ). 22/
While we are waiting for improved air quality policies to be put in place and upgraded infrastructure, there are also ways to improve the air you are breathing in places you don't control like wearing a tight sealing N95 respirator. 23/
Yes, N95 respirators actually work. If you want to learn *how* they work and which type is best, see this thread ( ). 24/
If you are wondering why you can still smell some nasty things like smoke while wearing a respirator that blocks viruses and bacteria, see this thread ( ). 25/
@threadreaderapp please unroll

• • •

Missing some Tweet in this thread? You can try to force a refresh
 

Keep Current with Jeff Gilchrist

Jeff Gilchrist Profile picture

Stay in touch and get notified when new unrolls are available from this author!

Read all threads

This Thread may be Removed Anytime!

PDF

Twitter may remove this content at anytime! Save it as PDF for later use!

Try unrolling a thread yourself!

how to unroll video
  1. Follow @ThreadReaderApp to mention us!

  2. From a Twitter thread mention us with a keyword "unroll"
@threadreaderapp unroll

Practice here first or read more on our help page!

More from @jeffgilchrist

Dec 2
#Variant update for #Ontario, #Canada (Dec. 2, 2023)

[Fixed version] This sankey diagram shows the EG.5.1 "Eris" clan of variants are currently most prevalent: >70%. COVID-19 by far has the highest virus activity and still very little flu. Graph by @Mike_Honey_ 🧵1/
Sankey graph showing top variants and their lineages from PCR test genomic sequencing. Visualization tool was created by @Mike_Honey_ ( https://app.powerbi.com/view?r=eyJrIjoiNzE5YzczODItMDQzMS00M2EzLWFjNWYtMjg3OTY3NTNhZDM3IiwidCI6ImRjMWYwNGY1LWMxZTUtNDQyOS1hODEyLTU3OTNiZTQ1YmY5ZCIsImMiOjEwfQ%3D%3D&pageName=ReportSection32240d6b62ba73667e98 )
Table showing percentage positivity of respiratory virus activity in Ontario with COVID-19 at 20% positive Influenza at 2.8% (A) & 9% (B) positivity, with RSV in second at 8.7% positivity. Table from: https://www.publichealthontario.ca/en/Data-and-Analysis/Infectious-Disease/Respiratory-Virus-Tool
Looking at specific variants, it seems HV.1 from the EG.5.* [Eris] family peaked at 40% and now dropping so failed to achieve dominance while HK.3 is holding steady in 2nd place around 15%. JN.1 is now on the board in the top 7 however. 2/ Graph of 7 COVID variant frequencies from PCR test genomic sequencing. Visualization tool was created by @Mike_Honey_ ( https://app.powerbi.com/view?r=eyJrIjoiNzE5YzczODItMDQzMS00M2EzLWFjNWYtMjg3OTY3NTNhZDM3IiwidCI6ImRjMWYwNGY1LWMxZTUtNDQyOS1hODEyLTU3OTNiZTQ1YmY5ZCIsImMiOjEwfQ%3D%3D )
Looking more closely at the BA.2.86.* [Pirola] clan, the more immune evasive descendant JN.1 is increasing very rapidly and may overtake all the others in the next month. 3/ Graph of BA.2.86.* Pirola clan from PCR test genomic sequencing in Ontario. Visualization tool was created by @Mike_Honey_ ( https://app.powerbi.com/view?r=eyJrIjoiNzE5YzczODItMDQzMS00M2EzLWFjNWYtMjg3OTY3NTNhZDM3IiwidCI6ImRjMWYwNGY1LWMxZTUtNDQyOS1hODEyLTU3OTNiZTQ1YmY5ZCIsImMiOjEwfQ%3D%3D )
Read 13 tweets
Dec 2
#Variant update for #Ontario, #Canada (Dec. 2, 2023)

This sankey diagram shows the EG.5.1 "Eris" clan of variants are currently most prevalent: >70%. COVID-19 by far has the highest virus activity and still very little flu. Graph by @Mike_Honey_ 🧵1/
Sankey graph showing top variants and their lineages from PCR test genomic sequencing. Visualization tool was created by @Mike_Honey_ ( https://app.powerbi.com/view?r=eyJrIjoiNzE5YzczODItMDQzMS00M2EzLWFjNWYtMjg3OTY3NTNhZDM3IiwidCI6ImRjMWYwNGY1LWMxZTUtNDQyOS1hODEyLTU3OTNiZTQ1YmY5ZCIsImMiOjEwfQ%3D%3D&pageName=ReportSection32240d6b62ba73667e98 )
Table showing percentage positivity of respiratory virus activity in Ontario with COVID-19 at 20% positive Influenza at 2.8% (A) & 9% (B) positivity, with RSV in second at 8.7% positivity. Table from: https://www.publichealthontario.ca/en/Data-and-Analysis/Infectious-Disease/Respiratory-Virus-Tool
Looking at specific variants, it seems HV.1 from the EG.5.* [Eris] family peaked at 40% and now dropping so failed to achieve dominance while HK.3 is holding steady in 2nd place around 15%. JN.1 is now on the board in the top 7 however. 3/ Graph of 7 COVID variant frequencies from PCR test genomic sequencing. Visualization tool was created by @Mike_Honey_ ( https://app.powerbi.com/view?r=eyJrIjoiNzE5YzczODItMDQzMS00M2EzLWFjNWYtMjg3OTY3NTNhZDM3IiwidCI6ImRjMWYwNGY1LWMxZTUtNDQyOS1hODEyLTU3OTNiZTQ1YmY5ZCIsImMiOjEwfQ%3D%3D )
Looking more closely at the BA.2.86.* [Pirola] clan, the more immune evasive descendant JN.1 is increasing very rapidly and may overtake all the others in the next month. 4/ Graph of BA.2.86.* Pirola clan from PCR test genomic sequencing in Ontario. Visualization tool was created by @Mike_Honey_ ( https://app.powerbi.com/view?r=eyJrIjoiNzE5YzczODItMDQzMS00M2EzLWFjNWYtMjg3OTY3NTNhZDM3IiwidCI6ImRjMWYwNGY1LWMxZTUtNDQyOS1hODEyLTU3OTNiZTQ1YmY5ZCIsImMiOjEwfQ%3D%3D )
Read 13 tweets
Nov 24
Why can you still smell things wearing an effective mask?

You can smell nasty things like smoke and rotten eggs even with fit tested #N95 respirators which block tiny viruses/bacteria because the smell molecules have atomic masses that are 17 million times less than a virus.🧵1/
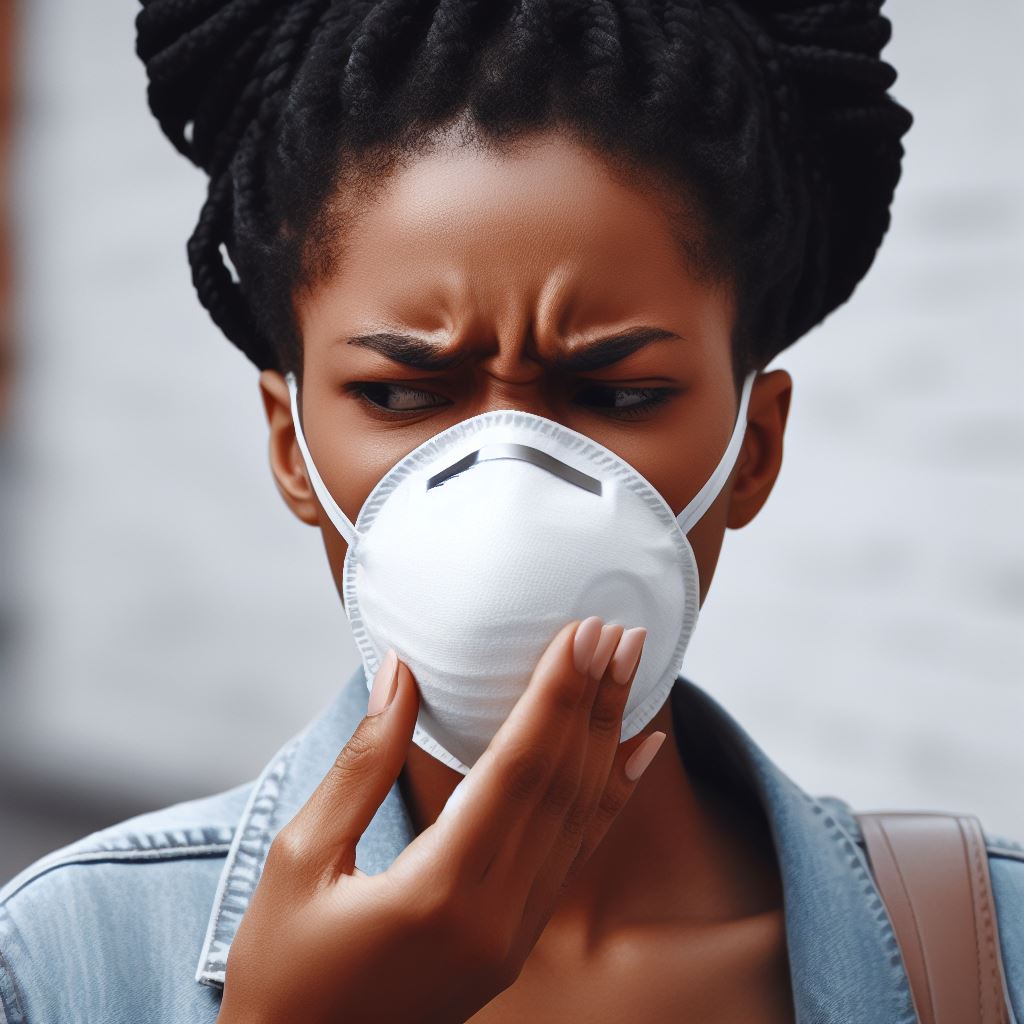
Image of a woman wearing an N95 respirator with an expression of disgust from smelling something bad. Generated using Bing Image Creator powered by DALL-E 3 using prompt, "A person wearing an N95 mask with an expression of disgust from smelling something bad"
Graph using logarithmic scale showing difference in atomic mass (Daltons) of various gases like oxygen, carbon dioxide and some you can smell ranging from 32 to 131 Daltons while the COVID-19 virus is millions of times more at 602 million Daltons and the aerosol it travels in is billions of times more at 160 billion Daltons.
This long thread (with info from @Wikisteff) explains how molecules detected in our olfactory receptors as #smells can pass through material in #masks, #respirators, and #filters (HEPA/MERV-13/CR Boxes) while still blocking tiny particles like #viruses and #particulate matter. 2/
An unrolled one-page web view for this long thread that may be easier to read or share can be found here ( ). 3/
Read 43 tweets
Nov 12
Virus update for Ottawa, ON, Canada (Nov 12, 2023)

#Wastewater levels in #Ottawa remain higher than the peak of the first #Omicron BA.1 wave and hospitalization *for* COVID-19 continues to increase ( ). 🧵1/ covid.gilchrist.ca/Ottawa.html

Graph of wastewater levels in Ottawa, Ontario. Weekly stats available at ( http://covid.gilchrist.ca/Ottawa.html )
Graph of # of people currently hospitalized *for* COVID-19 in Ottawa, Ontario. Weekly stats available at ( http://covid.gilchrist.ca/Ottawa.html )
Our young children are especially vulnerable to respiratory virus infections. In Ottawa there were 1110 respiratory related Emergency Department visits the week of Oct. 22 of which 50% were children aged 0-11, and a third were age 0-3 ( ). 2/ ottawapublichealth.ca/en/reports-res…
Graph showing % of total respiratory related ED visits by week in Ottawa, Ontario with children <12 making up 50% of all visits. Weekly stats available at ( http://covid.gilchrist.ca/Ottawa.html )
Which respiratory viruses are already circulating wildly? COVID-19 is by far the highest at 17% test positivity, followed a distant second by Entero/Rhinovirus (8.4%) and then RSV (5.8%)( ). 3/ publichealthontario.ca/en/Data-and-An…

Table of respiratory virus activity showing viruses and percent positivity from tests in Ontario. Stats available at ( https://www.publichealthontario.ca/en/Data-and-Analysis/Infectious-Disease/Respiratory-Virus-Tool )
Graph showing COVID-19 PCR test positivity and # of tests over time in Ottawa, Ontario. Weekly stats available at ( http://covid.gilchrist.ca/Ottawa.html )
Read 8 tweets
Nov 5
Variant update for Ontario, Canada (Nov. 5, 2023)

This sankey diagram shows the amount of variants being sequenced and their family lineage since Sep. 1, 2023 using @Mike_Honey_'s new addition to his visualizer. COVID-19 still has highest virus activity and almost no flu.🧵1/
Sankey graph showing top variants and their lineages from PCR test genomic sequencing. Visualization tool was created by @Mike_Honey_ ( https://app.powerbi.com/view?r=eyJrIjoiNzE5YzczODItMDQzMS00M2EzLWFjNWYtMjg3OTY3NTNhZDM3IiwidCI6ImRjMWYwNGY1LWMxZTUtNDQyOS1hODEyLTU3OTNiZTQ1YmY5ZCIsImMiOjEwfQ%3D%3D&pageName=ReportSection32240d6b62ba73667e98 )
Table showing percentage positivity of respiratory virus activity in Ontario with COVID-19 at 18.6% positive and Influenza at <= 0.5% positivity. Table from: https://www.publichealthontario.ca/en/Data-and-Analysis/Infectious-Disease/Respiratory-Virus-Tool
If you are sick right now, it is highly unlikely to be to flu and a recent study found that half of people's COVID-19 viral loads peaked on day 4 of symptoms so may not test positive on a rapid test in the first few days ( ). 2/ cidrap.umn.edu/covid-19/evolv…
Table showing percentage positivity of respiratory virus activity in Ontario with COVID-19 at 18.6% positive and Influenza at <= 0.5% positivity. Table from: https://www.publichealthontario.ca/en/Data-and-Analysis/Infectious-Disease/Respiratory-Virus-Tool
Recall that rapid tests do not amplify the virus like PCR tests so they will only test positive after you have a high viral load which may take several days to get to while your symptoms are from your immune response which can start right away even when viral loads are low. 3/
Read 11 tweets
Oct 22
If there are 1 in 23 people infected in Ontario like @MoriartyLab estimates, that means any group of 10 people has a 36% chance at least 1 person is infected, increases to almost 50% for 15 people and 67% for 25 people. Online calculator available here: tinyurl.com/2emnj8nj

Image
You can use the calculator to estimate the chance in your area by updating the values. If you are in Canada, you can use Dr. Moriarty's COVID hazard index to find the current rates in your province here ( ). 2/covid19resources.ca/covid-hazard-i…
You can read the unrolled 1 page version of the latest report from @MoriartyLab here ( ). 3/threadreaderapp.com/thread/1715930…
Read 4 tweets

Did Thread Reader help you today?

Support us! We are indie developers!


This site is made by just two indie developers on a laptop doing marketing, support and development! Read more about the story.

Become a Premium Member ($3/month or $30/year) and get exclusive features!

Become Premium

Don't want to be a Premium member but still want to support us?

Make a small donation by buying us coffee ($5) or help with server cost ($10)

Donate via Paypal

Or Donate anonymously using crypto!

Ethereum

0xfe58350B80634f60Fa6Dc149a72b4DFbc17D341E copy

Bitcoin

3ATGMxNzCUFzxpMCHL5sWSt4DVtS8UqXpi copy

Thank you for your support!

Follow Us on Twitter!

:(