
As a clinical health psychologist, I notice that many people are using psychological defense mechanisms to downplay the risk of COVID.
These are my Top 7 examples:
🧵
These are my Top 7 examples:
🧵
#1 – Denial – Pretending a problem does not exist to provide artificial relief from anxiety.
Examples:
“During COVID” or “During the pandemic” (past tense)
“The pandemic is over”
“Covid is mild”
“It’s gotten milder”
“Covid is now like a cold or the flu”
“Masks don’t work anyway”
“Covid is NOT airborne”
“Pandemic of the unvaccinated”
“Schools are safe”
“Children don’t transmit COVID”
“Covid is mild in young people”
“Summer flu”
“I’m sick but it’s not Covid”
Taking a rapid test only once
Using self-reported case estimates (25x underestimate) rather than wastewater-derived case estimation
Using hospitalization capacity estimates to enact public health precautions (lagging indicator)
Citing mortality estimates rather than excess mortality estimates. Citing excess mortality without adjusting for survivorship bias.


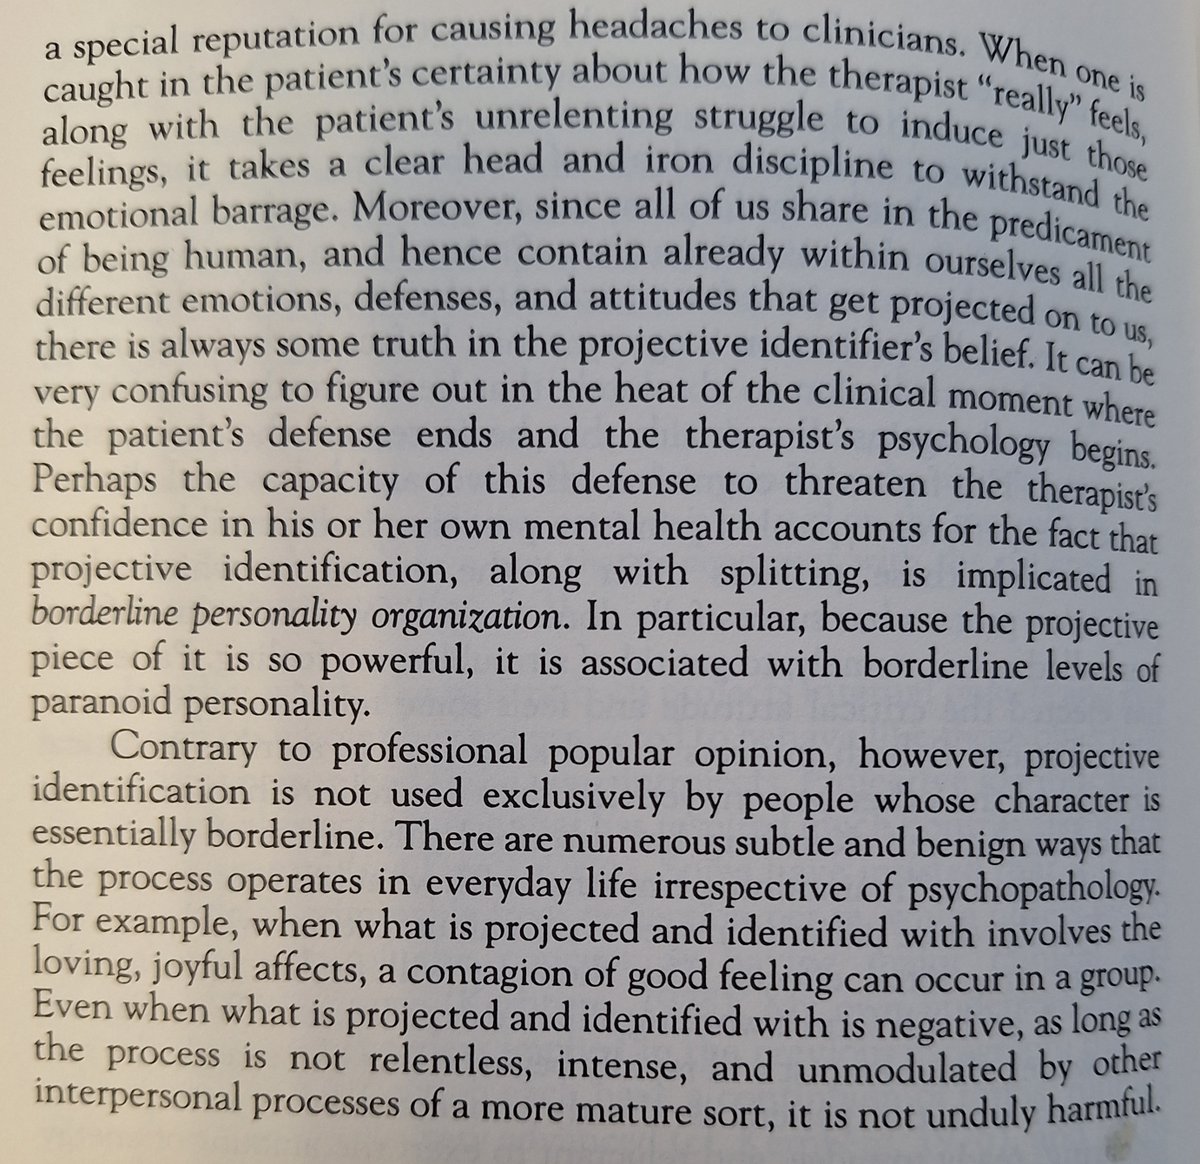
#2 – Projection – When someone takes what they are feeling and attempts to put it on someone else to artificially reduce their own anxiety.
Examples:
“Stop living in fear.” (the attacker is living in fear)
“You can take your mask off.” (they are insecure about being unmasked themselves)
“When are you going to stop masking?”
“You can’t live in fear forever.”
Examples:
“Stop living in fear.” (the attacker is living in fear)
“You can take your mask off.” (they are insecure about being unmasked themselves)
“When are you going to stop masking?”
“You can’t live in fear forever.”


#3 – Displacement – When someone takes their pandemic anxiety and redirects their discomfort toward someone or something else.
Examples:
Angry, seemingly inexplicable outbursts by co-workers, strangers, or family
White affluent people caring less about the pandemic after learning that it disproportionately affects lower-socioeconomic status people of color
Scapegoating based on vaccination status, masking behavior, etc.
“Pandemic of the unvaccinated”
Vax and relax
“How many of them were vaccinated?” (troll comment on Covid deaths or long Covid)
Redirecting anxiety about mitigating a highly-contagious airborne virus by encouraging people to do simple ineffective mitigation like handwashing
“You do you” (complainers are the problem, not Covid)
Telling people to get vaccinated or take other precautions against the flu or RSV but not mentioning Covid
Parents artificially reducing their own anxiety by placing children in poorly mitigated environments
Clinicians artificially reducing their own anxiety by placing patients in poorly mitigated environments
Housework to distract from stress
Peer pressure not to mask


#4 – Compartmentalization – Holding two conflicting ideas or behaviors, such as caution and incaution, rather than dealing with the anxiety evoked by considering the incautious behaviors more deeply (hypocrisy)
Hospitals and clinicians claim to value health/safety but then don’t require universal precautions
Public health officials claim to value evidence but then give non-evidence based advice (handwashing over masking), obscure or use low-value data over high-quality data (self-reported case counts over wastewater), etc.
Getting a flu vaccine but not a Covid vaccine
Interviewing long Covid experts who recommend masking in indoor public spaces but then going to Applebee’s
Masking in one potentially risky setting (grocery store) but not masking in another similar or more-risky setting (classroom)
Infectious disease conference where people are unmasked
Long Covid and other patient-advocacy meetings where only half the people mask
In-person only EDI events
Not testing because it’s just family
Mask breaks

#5 – Reaction formation – expressing artificial positive feelings when actually experiencing anxiety
“It’s good I got my infection out of the way before the holidays”
“I had Covid but it was mild”
Anything quoted in Dr. Jonathan Howard’s book, “We Want Them Infected: How the Failed Quest for Herd Immunity Led Doctors to Embrace Anti-Vaccine Movement”
Herd immunity (infections help)
Hybrid immunity (infections help)
“It’s okay because I was recently vaccinated”
“Omicron is milder”
“Textbook virus”
“Building immunity”


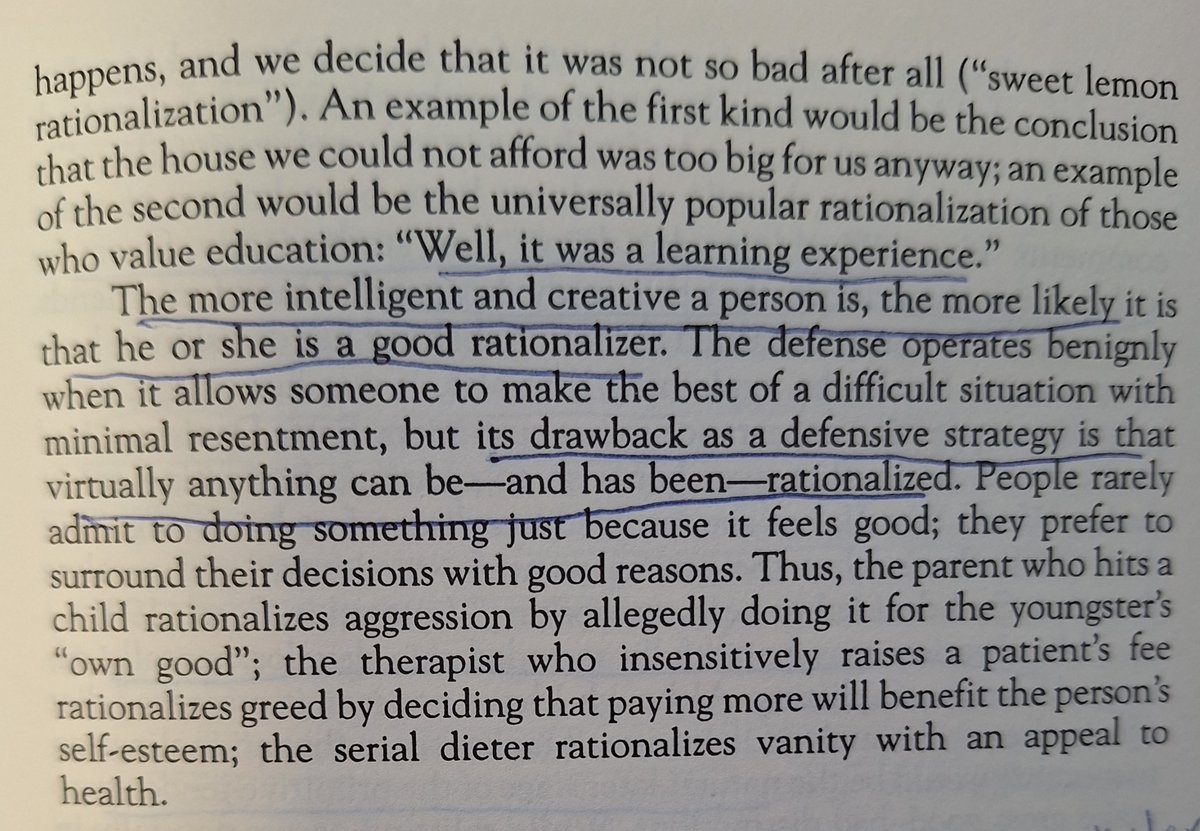
#6 – Rationalization – Artificially reducing Covid anxiety through a weak justification.
Examples:
“I didn’t mask but I used nasal spray”
“I don’t need to mask because I was recently vaccinated”
“It finally got me.”
“You’re going to get Covid again and again and again over your life.”
“It’s not Covid because I don’t have a sore throat.”
“It’s not Covid because I took a rapid test 3 days ago.”
“It’s not Covid because I’m vaccinated.”
“Airplanes have excellent ventilation.”
“I’ve had Covid three times. It’s mild.”
“Verily was cheaper.”
“Nobody else is masking.”
“Nobody else is testing.”
“My roommates don’t take any precautions, so there’s no point in me either.”
“I have a large family, so there’s no point in taking precautions.”
Surgical masks (they are actual “procedure masks,” by the way)
Various pseudo-scientific treatments used by the left and right
Handwashing as the primary Covid public health recommendation
Droplet transmission as a thing
Public health guidance that begins with “data shows” (sic)
Risk maps that never turn deep red
5 expired rapid tests
“Masks recommended” instead of universal precautions
“Seasonal”

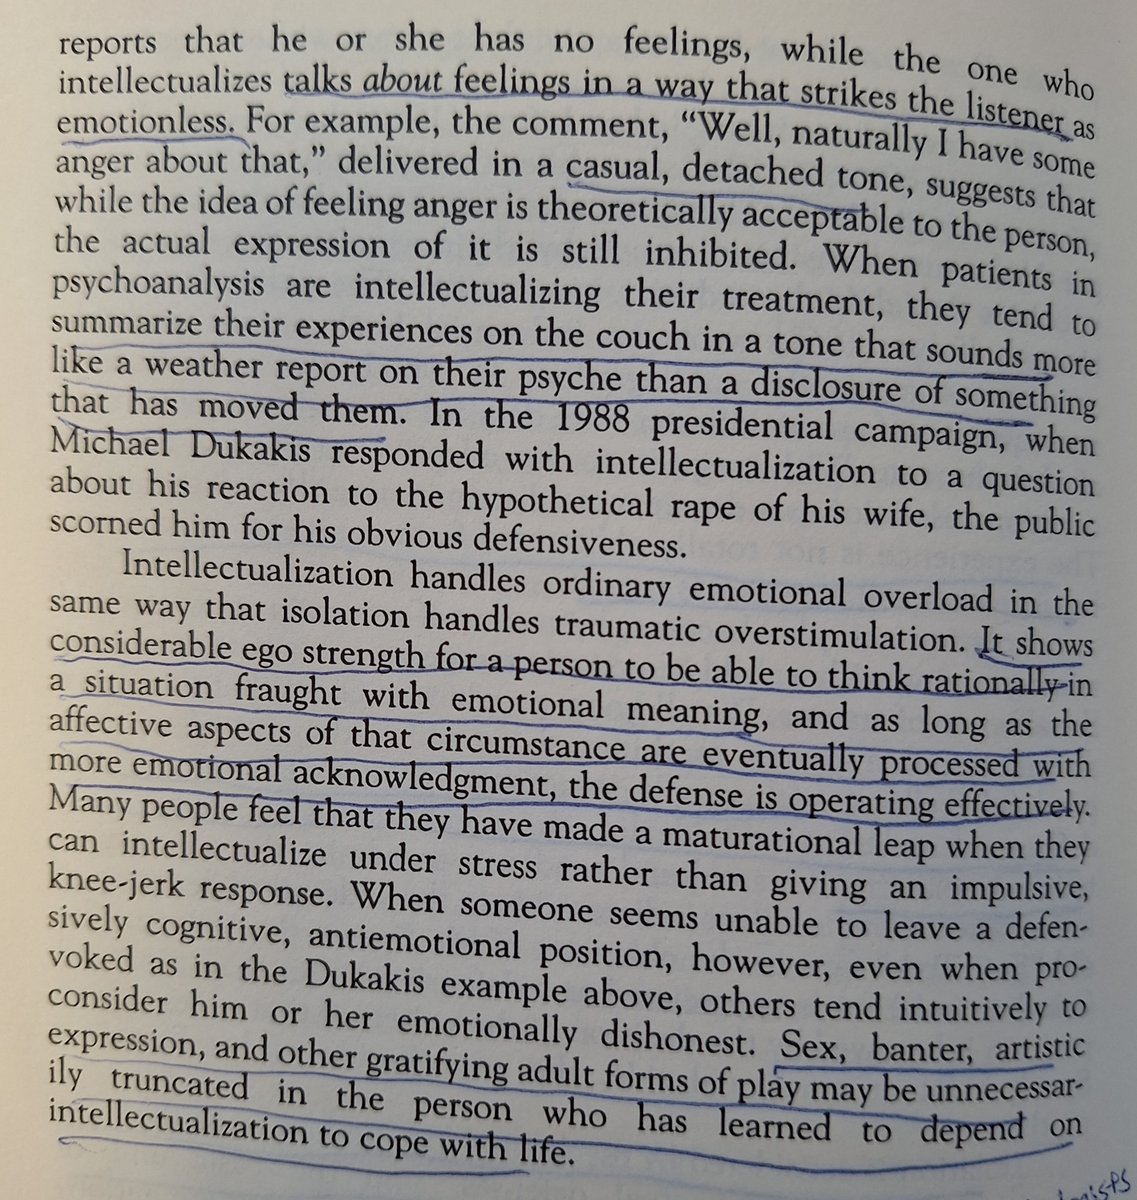
#7 – Intellectualization – using extensive cognitive arguments to artificially circumvent Covid anxiety
Examples:
Unending threads to justify indoor dining
Data-rich public health dashboards that use low-quality metrics and/or don’t change public health recommendations as risk increases
The entire justification for “off-ramps”
Oster, Wen, Prasad
Schools denying air cleaners because it “could make children anxious”
Schools not rapid testing this surge because it “could make children anxious”
The mental gymnastics underlying the rationales for who can get vaccinated, how frequently, or with what brand
Service workers told not to mask because it could make clients uncomfortable
“What comorbidities did they have?”
“The vulnerable will fall by the wayside”
Musicians and others holding large indoor events
5-day isolation periods

Here's a link to the full book, a newer edition than what I own. The information on defense mechanisms begins on textbook page 100.
Please let me know if there's a more accessible alt-text solution that you would prefer so I can do better next time.
isotis.files.wordpress.com/2016/07/mcwill…
Please let me know if there's a more accessible alt-text solution that you would prefer so I can do better next time.
isotis.files.wordpress.com/2016/07/mcwill…
• • •
Missing some Tweet in this thread? You can try to
force a refresh


