
PMC COVID-19 Forecast, June 28, 2024 (U.S.)
You've got about 1 good month left for higher risk medical and dental visits.
Expect 500,000 to 600,000 infections/day the next month -- in a summer "lull."
1/
You've got about 1 good month left for higher risk medical and dental visits.
Expect 500,000 to 600,000 infections/day the next month -- in a summer "lull."
1/

PMC COVID-19 Forecast, June 28, 2024 (U.S.)
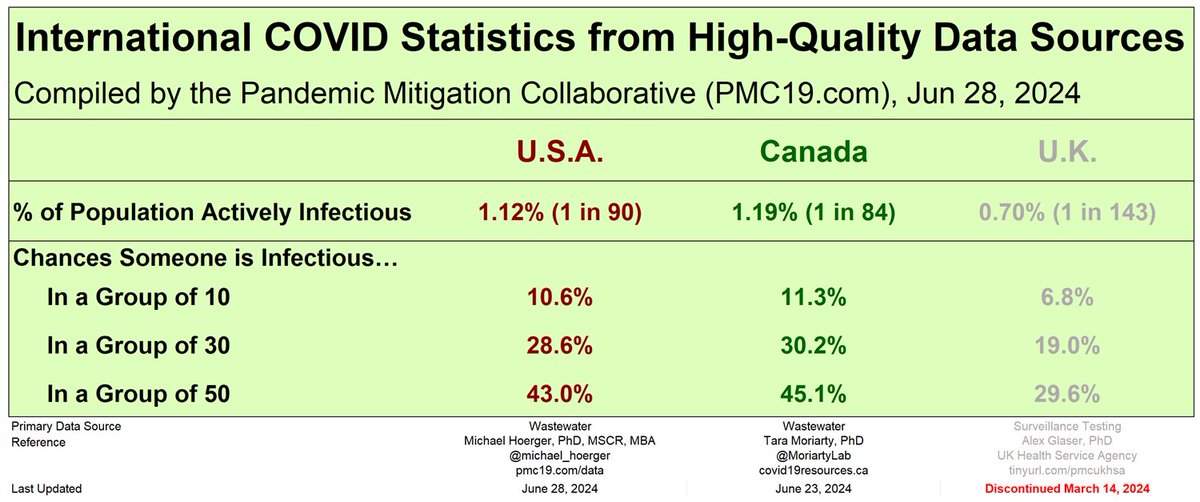
1.1% of the U.S. is actively infectious (1 in 90). We're looking at 3.7 million infections/week and 187,000+ resulting Long COVID cases/week.
That's 129 million infections in 2024 so far.
2/
1.1% of the U.S. is actively infectious (1 in 90). We're looking at 3.7 million infections/week and 187,000+ resulting Long COVID cases/week.
That's 129 million infections in 2024 so far.
2/

PMC COVID-19 Forecast, June 28, 2024 (U.S.)
How does transmission compare to late June in past years?
2023: 1.9x higher today
2022: 2.3x higher in 2022 (BA.2 surge) than today
2021: 5.6x higher today
2020: 2.8x higher today
We're in a hot "lull" with #backtoschool soon.
3/
How does transmission compare to late June in past years?
2023: 1.9x higher today
2022: 2.3x higher in 2022 (BA.2 surge) than today
2021: 5.6x higher today
2020: 2.8x higher today
We're in a hot "lull" with #backtoschool soon.
3/

PMC COVID-19 Forecast, June 28, 2024 (U.S.)
With the UK surveillance study tabled, our best international comparison is Canada.
Note that independent estimates there from Dr. @MoriartyLab's team are eerily similar to our own US-based estimates. Data you can trust.
4/
With the UK surveillance study tabled, our best international comparison is Canada.
Note that independent estimates there from Dr. @MoriartyLab's team are eerily similar to our own US-based estimates. Data you can trust.
4/
PMC COVID-19 Forecast, June 28, 2024 (U.S.)
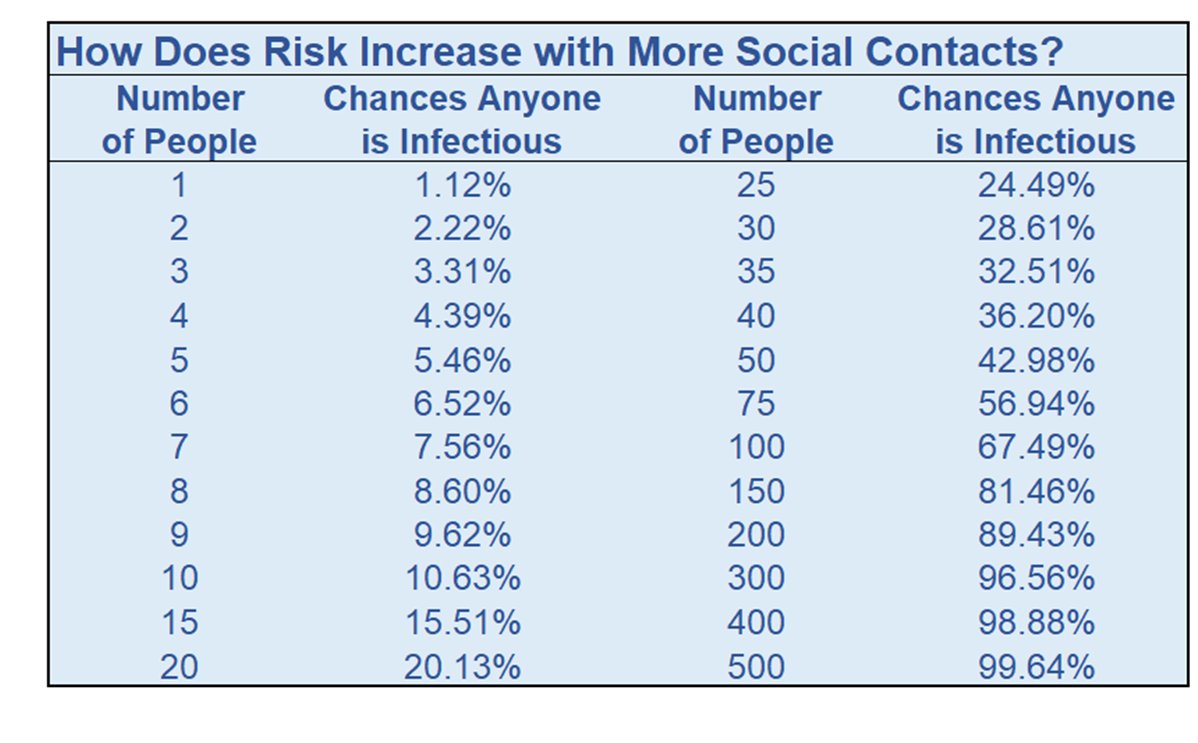
If you interact with 20 people this week, there's about a 1 in 5 chance someone was actively infectious with Covid. Interact with 100 people? 2 in 3 chance someone has Covid.
#MaskUp
5/
If you interact with 20 people this week, there's about a 1 in 5 chance someone was actively infectious with Covid. Interact with 100 people? 2 in 3 chance someone has Covid.
#MaskUp
5/
PMC COVID-19 Forecast, June 28, 2024 (U.S.)
You can catch the entire dashboard online. Please share across other platforms. Thanks!
6/
pmc19.com/data/
You can catch the entire dashboard online. Please share across other platforms. Thanks!
6/
pmc19.com/data/
• • •
Missing some Tweet in this thread? You can try to
force a refresh


