Richard Dias Profile picture
Feb 5, 2025 9 tweets 3 min read Read on X
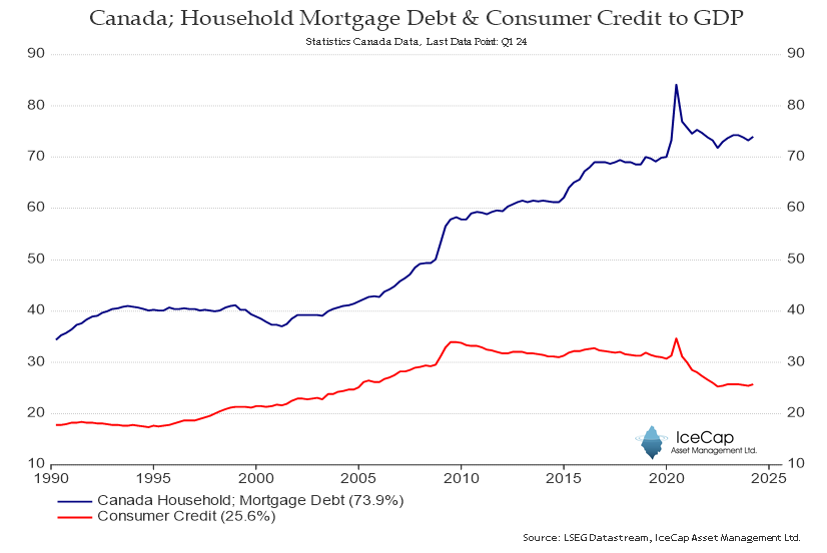
Canada's December Trade Data was released this morning.

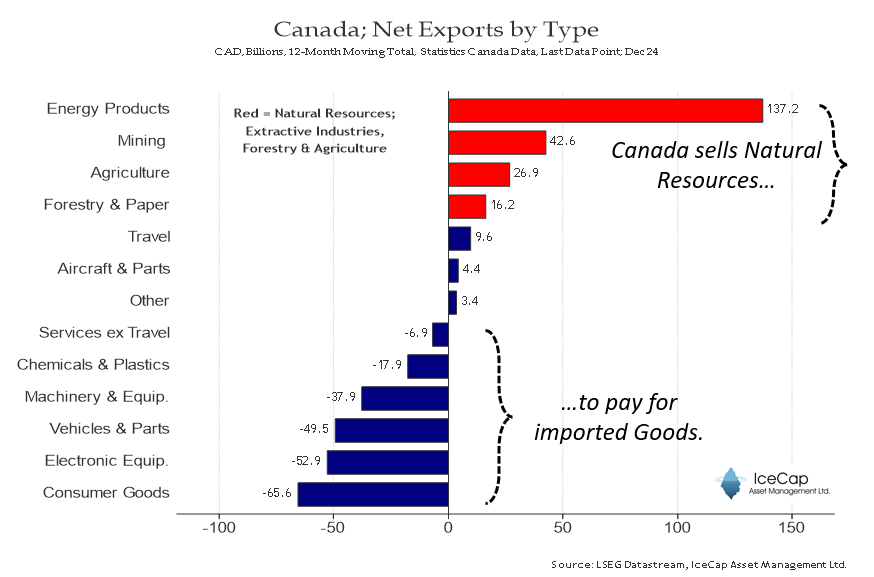
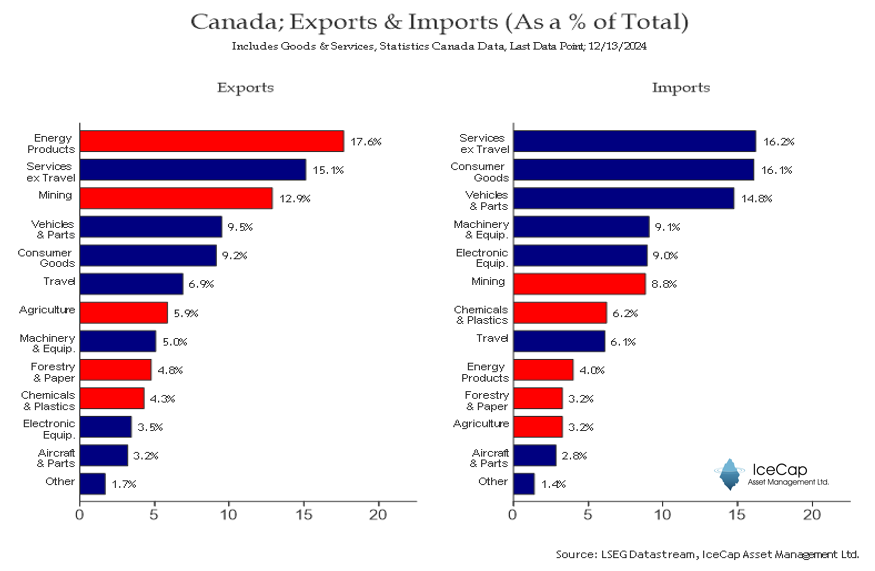
Conclusion: Canada sells Natural Resources (i.e. Crude Oil, Minerals, & Agricultural Products) to pay for Imported Goods. A thread...🧵 www150.statcan.gc.ca/n1/daily-quoti…Image
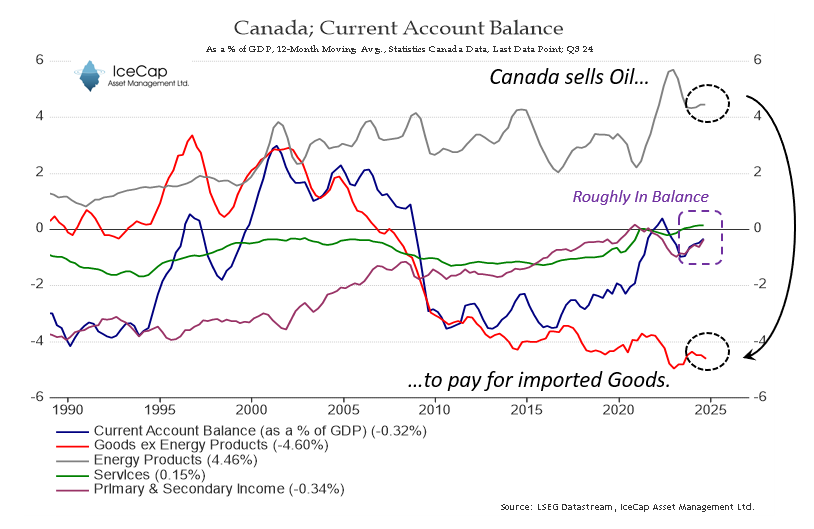
The importance of Energy Exports is particularly clear when one considers the current account balance.

Without the massive, sustained positive contribution, our Current Account Balance would be deeply negative, requiring a painful readjustment, such as a lower exchange rate or fewer imports (consumption).Image
Of course, it is more complicated than that. Canada exports billions of dollars worth of other Goods and Services, and we Import plenty of Natural Resources. Image
Percentage shares make more sense to me

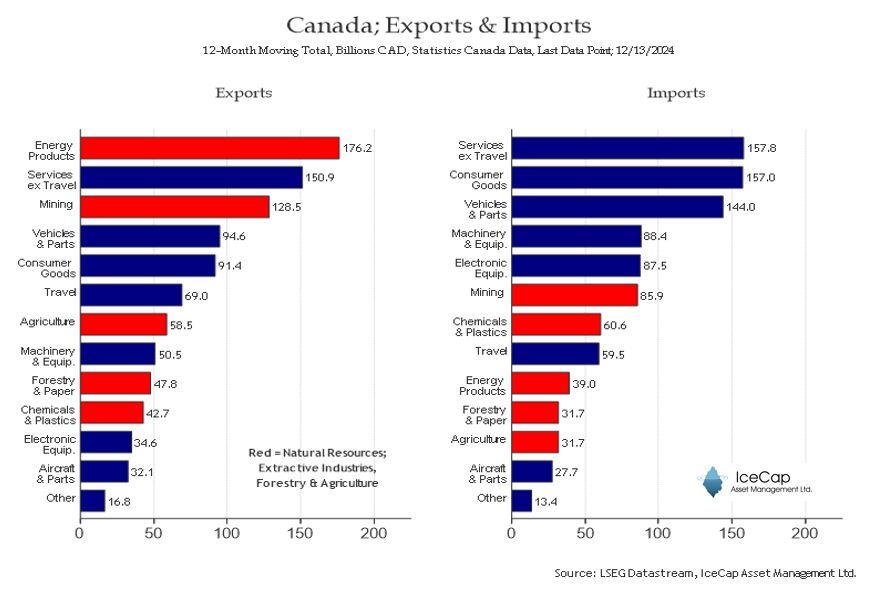
Note that Services are included. Image
The growth of Goods Exports has rebounded after bottoming in 23/24. Services are still under pressure.

Note that price changes will affect these figures. Image
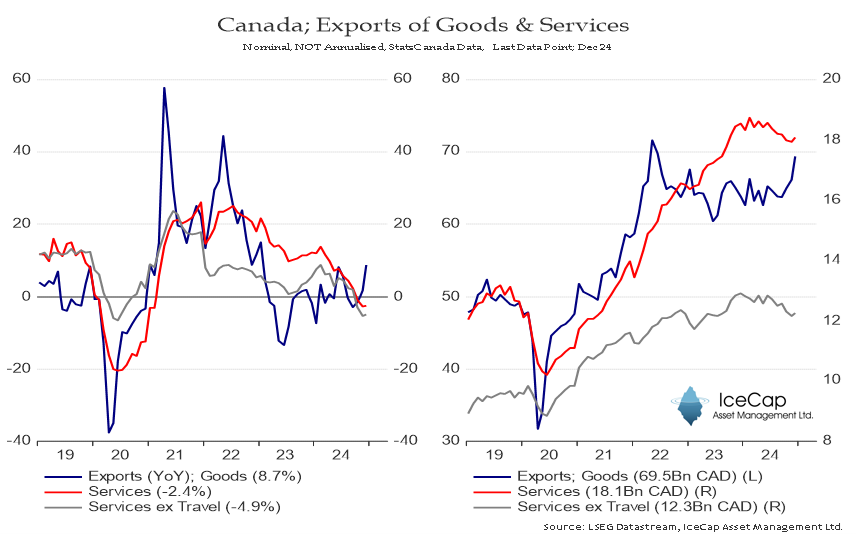
It's a similar situation with Imports. Services are soft. Keep an eye on Services going forward. Image
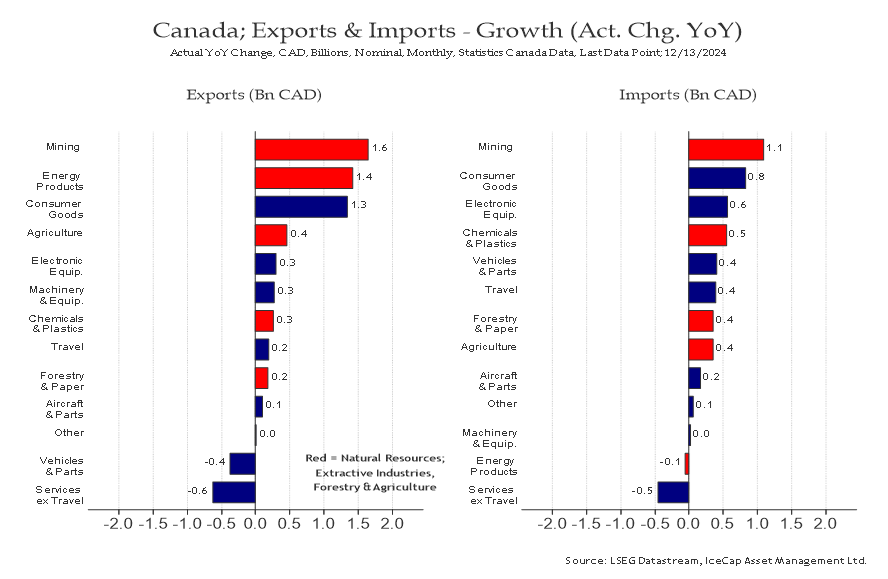
One can derive where the pop in Goods Exports and Imports comes from with the following YoY Billions bar chart. And you can see the decline in Services YoY. Image
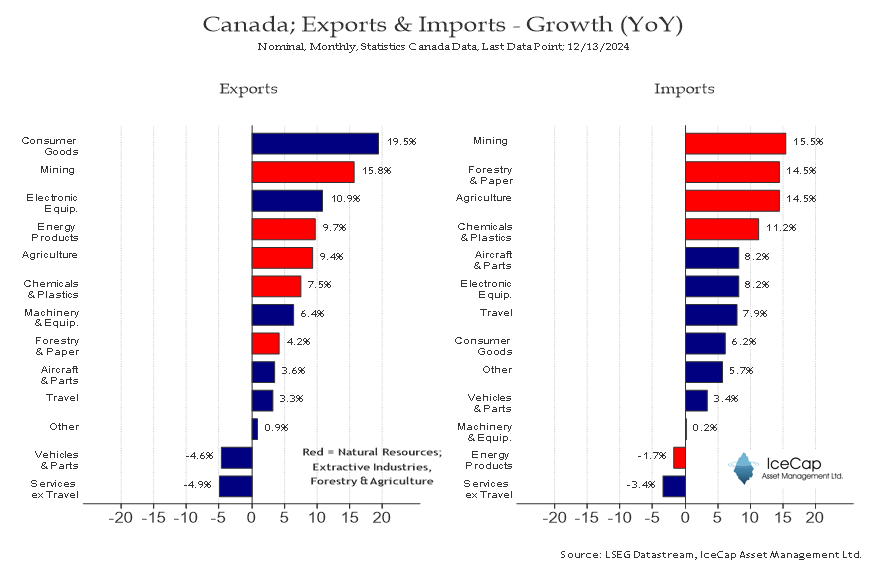
Again, year-over-year percentage changes also paint a picture. Exports of Consumer Goods showed the biggest year-over-year improvement. This also shows the significance of Natural Resource Imports. Image
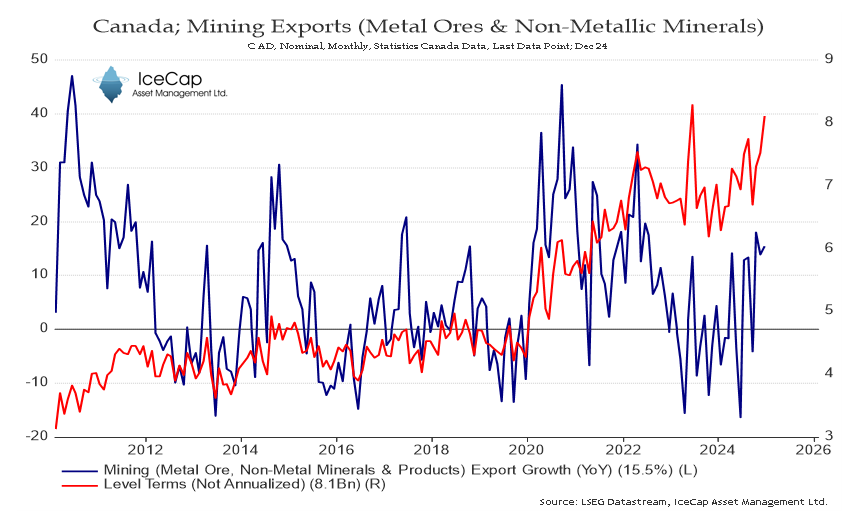
Finally, some of you might be curious about the nature of each individual series. As you can see, they fluctuate wildly on a monthly basis; this is due to volume, price, seasonality, and a bunch of other factors that impact export (or import) value.

end/ Image

• • •

Missing some Tweet in this thread? You can try to force a refresh
 

Keep Current with Richard Dias

Richard Dias Profile picture

Stay in touch and get notified when new unrolls are available from this author!

Read all threads

This Thread may be Removed Anytime!

PDF

Twitter may remove this content at anytime! Save it as PDF for later use!

Try unrolling a thread yourself!

how to unroll video
  1. Follow @ThreadReaderApp to mention us!

  2. From a Twitter thread mention us with a keyword "unroll"
@threadreaderapp unroll

Practice here first or read more on our help page!

More from @RichardDias_CFA

Sep 5, 2025
Canada's Labour Force Survey Employment declined by 66.5k, down to 20.955Mn in August. This is an 8-month low. The Unemployment Rate rose 0.2% to 7.1%. A thread... www150.statcan.gc.ca/n1/daily-quoti…Image
A look at the Sectors reveals that the decline was driven by a significant drop in Professional, Scientific & Technical Services, as well as Logistics and Manufacturing. Surprisingly, Construction added 17k new jobs.

As always, Public Administration grew. 🙄 Image
A look at the broader definition of Public Sector Employment, however, points to a decline.

Total ex Public Employment fell by 50k. Image
Read 8 tweets
Apr 4, 2025
Canadian Employment (LFS) fell 32.6k - more than expected (10.0k exp). A Thread.🧵

It's too early to tell if this is the start of a protracted decline in employment or just an unwind from the GST Holiday sugar rush.

My bet is on the former. Image
But a look at the Sector breakdown and the large decline in Trade (retail & wholesale) gives me pause. Image
The Unemployment Rate rose to 6.7%. There are 1.5Mn unemployed Canadians. Image
Read 7 tweets
Mar 20, 2025
Boomers have been insulated from some of the worst policy mistakes in a generation. No Housing, No Capital, No CAPEX, No Productivity, No Hope?

Young people had better vote as if their lives depended on it. Otherwise, expect another 10 years of stagnation. Image
No Housing Image
No Capital Image
Read 6 tweets
Mar 5, 2025
Timing is everything, and this Tariff War is precisely what the Federal Government needed to distract Canadians from their abysmal economic record. From Capital Flight, Falling Investment, and my personal favourite, a collapse in Productivity Growth. The data speaks for itself.⬇️ Image
The Receipts;

Capital Flight Image
Falling Private Sector Investment Image
Read 11 tweets
Aug 23, 2024
Canadian Households are highly leveraged. Over the last 25 years, Household debt has quintupled to nearly 3 trillion dollars or 100% of GDP. Image
As you may have surmised, the run-up in debt has been primarily due to mortgage debt, which has fueled one of the world’s more acute housing bubbles. Consumer credit has been quite stable. Image
Unsurprisingly, the other countries at the top of the table have also suffered from huge increases in house prices. Image
Read 6 tweets
Jun 22, 2022
A thread on Canadian #inflation:

As you may know by now, Headline Inflation hit 7.73% in May vs. 7.4% exp. This is a 39-Year high.

The last time inflation was this high, Mike Bossy & Bryan Trottier lead the Islanders to their 4th straight Stanley Cup.
Core Inflation less 8 Volatile Components & Effects of Indirect Taxes also hit a 39-year high - 6.1%

Core Inflation less Food & Energy is roughly 5%.

There are different ways to measure core - more on that later...
Long-time followers know its important to review the components. First, Goods & Services;

Goods inflation (10.4%) is at a 40-year high.

But the 2 takeaways from this chart are that Services inflation (5.2%) keeps heading higher & Services is less volatile (ie, it's sticky).
Read 9 tweets

Did Thread Reader help you today?

Support us! We are indie developers!


This site is made by just two indie developers on a laptop doing marketing, support and development! Read more about the story.

Become a Premium Member ($3/month or $30/year) and get exclusive features!

Become Premium

Don't want to be a Premium member but still want to support us?

Make a small donation by buying us coffee ($5) or help with server cost ($10)

Donate via Paypal

Or Donate anonymously using crypto!

Ethereum

0xfe58350B80634f60Fa6Dc149a72b4DFbc17D341E copy

Bitcoin

3ATGMxNzCUFzxpMCHL5sWSt4DVtS8UqXpi copy

Thank you for your support!

Follow Us!

:(