
PMC Dashboard, Mar 24, 2025 (U.S.)
🧵1/5
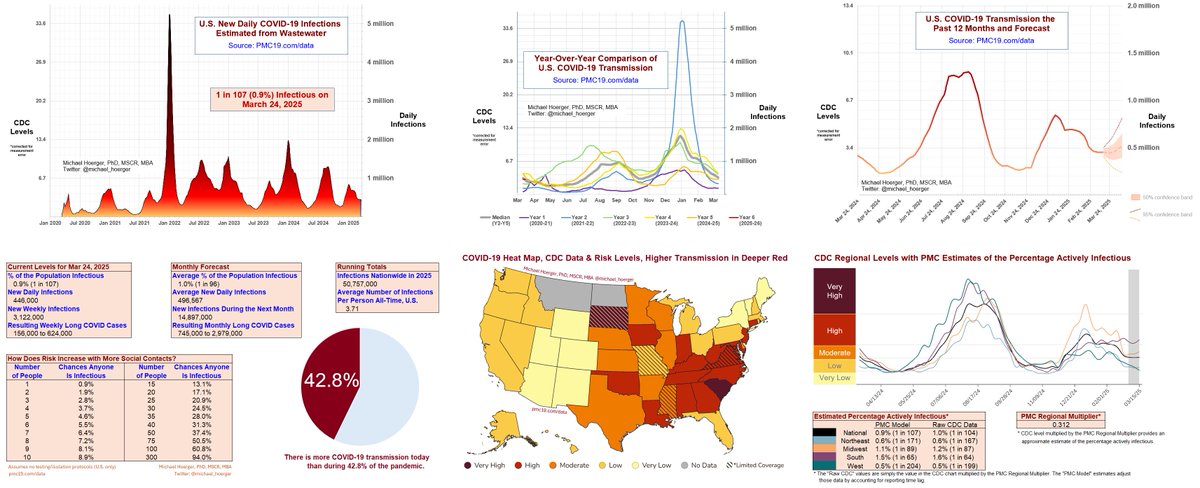
🔹3 million new weekly infections in a persistent "lull" of substantial transmission
🔹1 in 107 (0.9%) of the population actively infectious
🔹1 in 3 regions in high/very high transmission (16 states and DC)
🧵1/5
🔹3 million new weekly infections in a persistent "lull" of substantial transmission
🔹1 in 107 (0.9%) of the population actively infectious
🔹1 in 3 regions in high/very high transmission (16 states and DC)

PMC Dashboard, Mar 24, 2025 (U.S.)
🧵2/5
We have had a steady state of about a half million infections the past several weeks. That's over 50 million estimated infections so far in 2025.
In a room of 40-50 people, there's a 1-in-3 chance of exposure if no testing/isolation.
🧵2/5
We have had a steady state of about a half million infections the past several weeks. That's over 50 million estimated infections so far in 2025.
In a room of 40-50 people, there's a 1-in-3 chance of exposure if no testing/isolation.

PMC Dashboard, Mar 24, 2025 (U.S.)
🧵3/5
There's a good chance of steady transmission the next month. Often, we'd head into a low lull about now. BUT there are no universal precautions, immunity is waning from the fall & winter 2023-24, & viral evolution looks less 'lucky.'
🧵3/5
There's a good chance of steady transmission the next month. Often, we'd head into a low lull about now. BUT there are no universal precautions, immunity is waning from the fall & winter 2023-24, & viral evolution looks less 'lucky.'

PMC Dashboard, Mar 24, 2025 (U.S.)
🧵4/5
We just passed the 5-year anniversary, now with 10 waves in the U.S.
Americans may see an average of about 8 infections by year 10. We continue to see about 150k excess deaths annually, per actuaries.
🧵4/5
We just passed the 5-year anniversary, now with 10 waves in the U.S.
Americans may see an average of about 8 infections by year 10. We continue to see about 150k excess deaths annually, per actuaries.
https://x.com/michael_hoerger/status/1899412184200864133
PMC Dashboard, Mar 24, 2025 (U.S.)
🧵5/5
Please edit, improve, and share this information across platforms. 🎉👏👏👏
Find the complete dashboard at pmc19.com/data
🧵5/5
Please edit, improve, and share this information across platforms. 🎉👏👏👏
Find the complete dashboard at pmc19.com/data
• • •
Missing some Tweet in this thread? You can try to
force a refresh


