Some charts that caught my eye from Bain's global private equity 2025 report
🧵
1/ Global buyout exits increased +34% y/y in 2024 but fundraising for buyout funds dropped -23% y/y
🧵
1/ Global buyout exits increased +34% y/y in 2024 but fundraising for buyout funds dropped -23% y/y

2/ AUM for private equity increased at a 14% CAGR through 2015 to 2023, but remained flat through 2Q24

3/ Follow-on funds are becoming harder to raise for bottom quartile firms. Even top quartile funds having some challenges, but still able to raise effectively

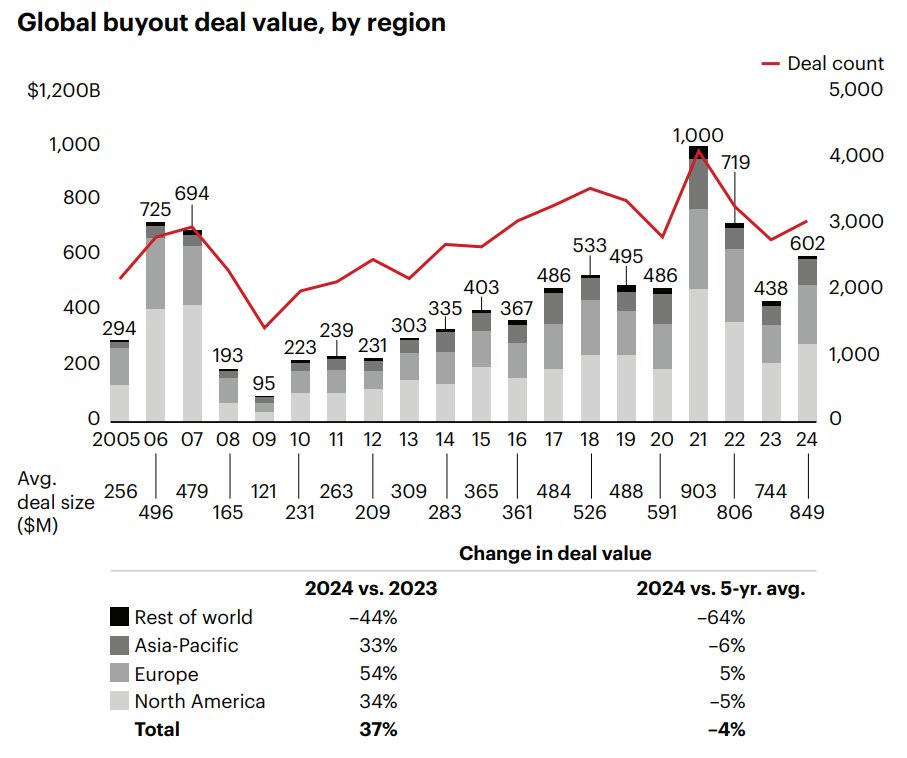
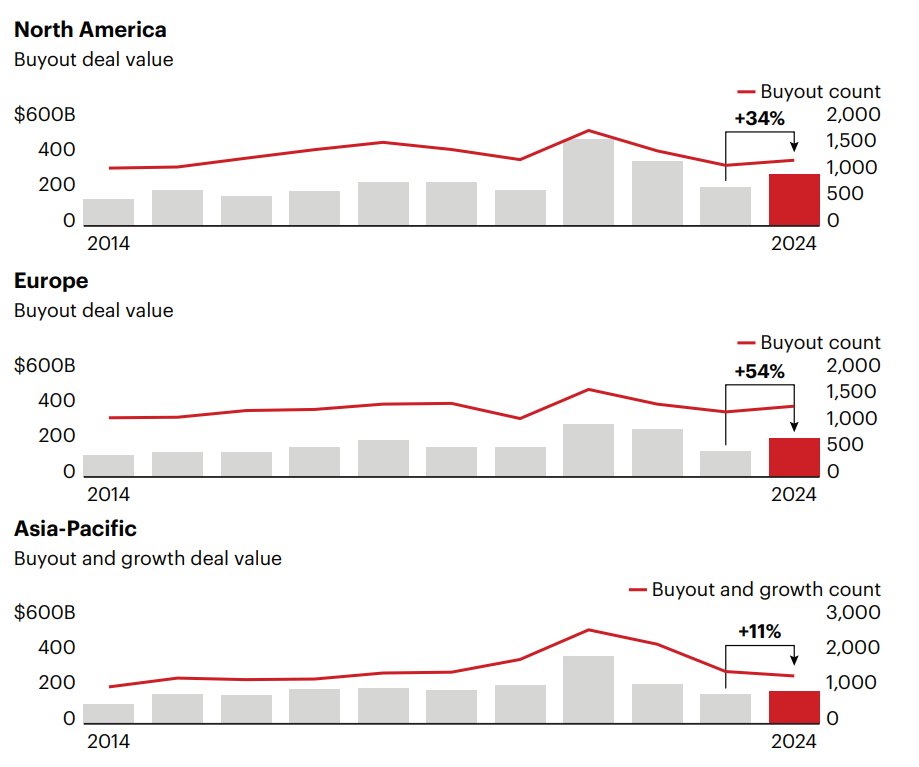
4/ Deal value recovered in 2024 vs 2023, but remains muted vs 5 year average.
Europe, in particular, showed the most strength with 54% y/y increase and +5% vs 5 year average
Europe, in particular, showed the most strength with 54% y/y increase and +5% vs 5 year average
5/ Similar data being broken down here but Europe saw the largest bounce in deal value at +54% y/y
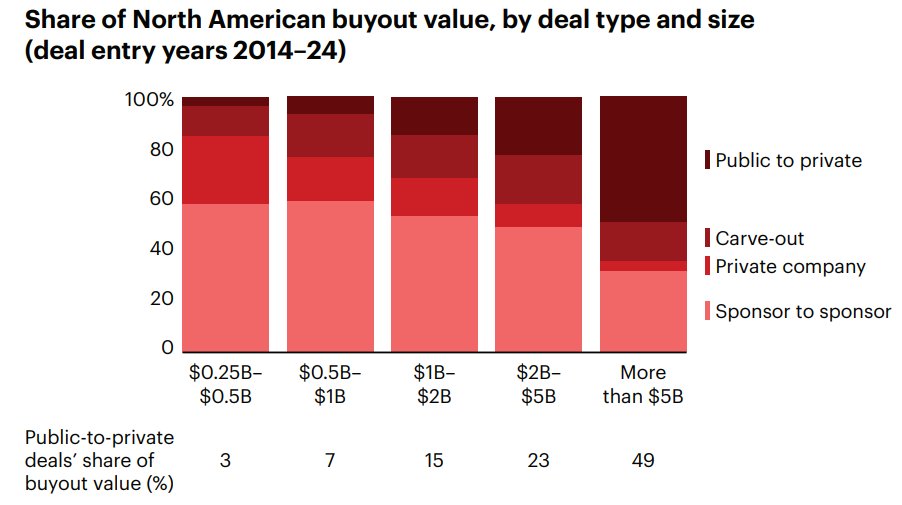
6/ 2024 was a good year for larger deal sizes. Average deal was $849M vs $744M in 2023

7/ Public to private was almost 50% of all deal value of deals $5BN+
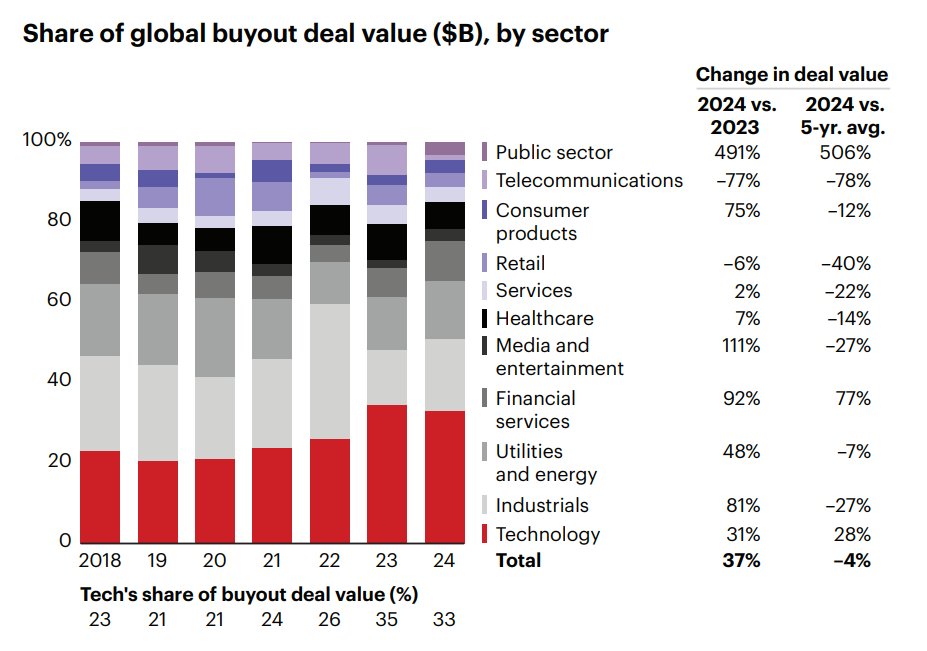
8/ Buyout deal value by sector
Most sectors rebounded in 2024 but still remain below 5 year averages
Telecom, media, retail, and industrials still well below 5 year average
Technology 28% above 5 year average
Most sectors rebounded in 2024 but still remain below 5 year averages
Telecom, media, retail, and industrials still well below 5 year average
Technology 28% above 5 year average
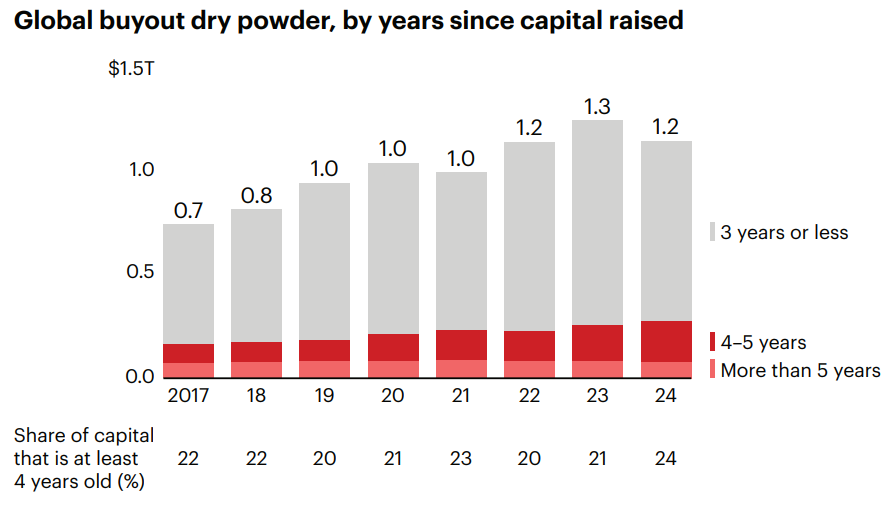
9/ Roughly 24% of all dry powder is now at least 4 years old, highest since 2017
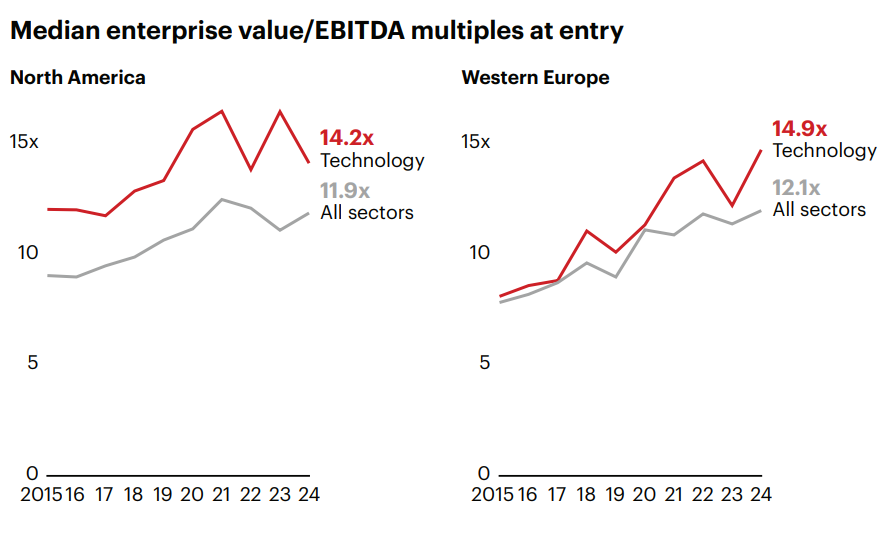
10/ Median TEV multiples pretty consistent across North America and Europe, and both at or near all time highs

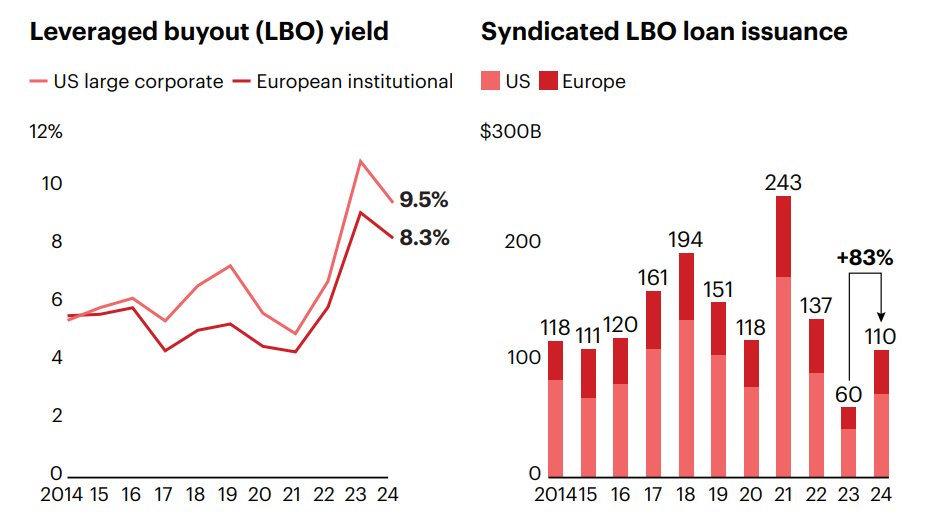
11/ Syndicated debt for LBOs saw a +83% y/y increase in 2024
LBO debt yield is higher at U.S. large corporates
LBO debt yield is higher at U.S. large corporates
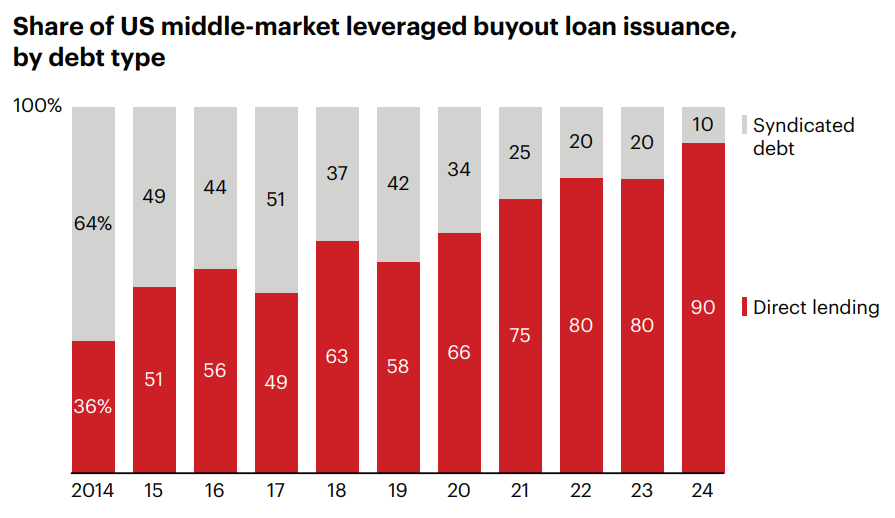
12/ Private credit continuing to eat market share from syndicated markets, especially in middle market LBOs
13/ Sponsor to sponsor deal the only exit channel above 5 year average
IPOs -46% and strategic sale -27% vs 5 year average
IPOs -46% and strategic sale -27% vs 5 year average

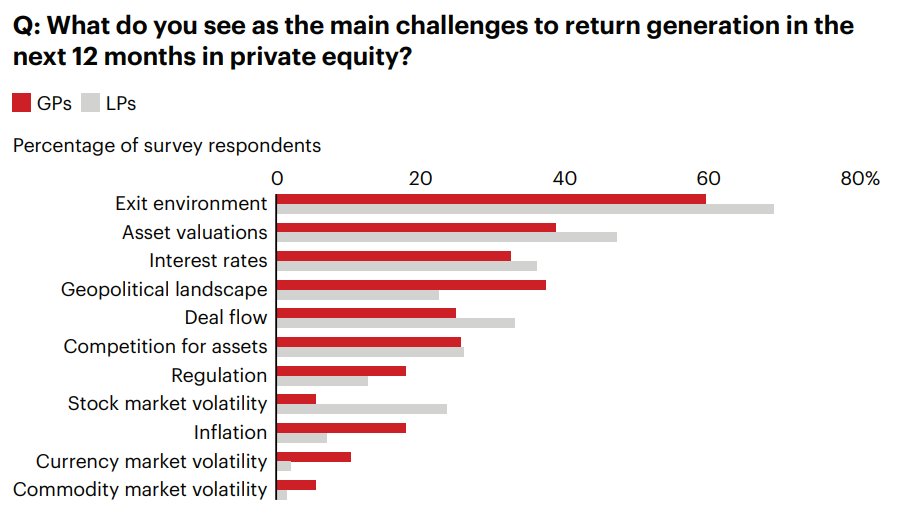
14/ LPs and GPs both agree that exit environment is the biggest challenge to return generation for next 12 months
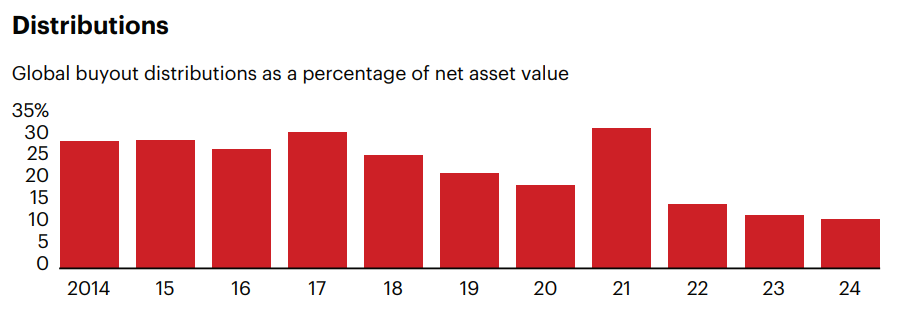
15/ Buyout distributions as a % of NAV lowest it has been in almost a decade
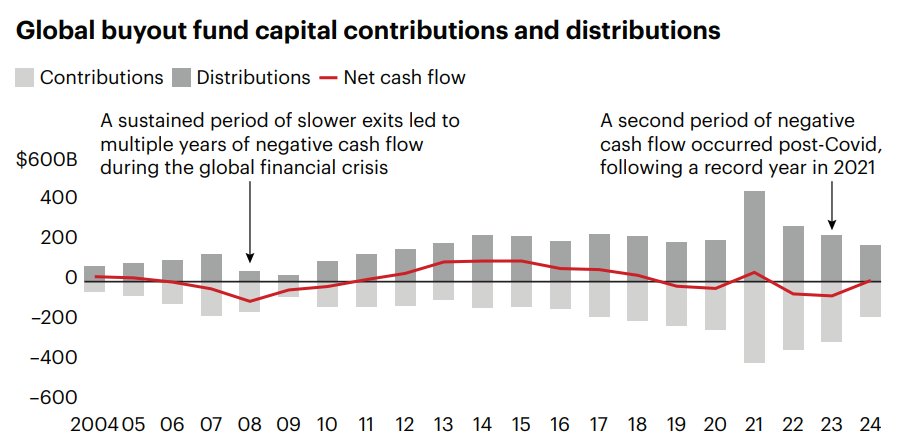
16/ Buyout net cash flow was negative through '22-23 after a record year in 2021
2024 closer to breakeven. Net cash flow highest during 2012 to 2017, which was roughly the middle of the ZIRP era
2024 closer to breakeven. Net cash flow highest during 2012 to 2017, which was roughly the middle of the ZIRP era
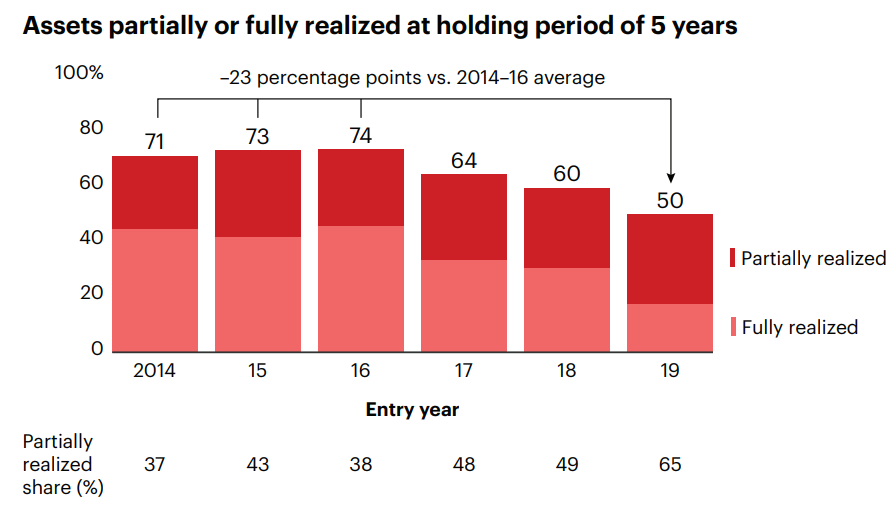
17/ Partially realized share of assets is highest it has been
This only looks at assets with a holding period of 5 years
Partial realization likely means dividend distribution, minority equity sales, asset divestitures etc. vs full sale
This only looks at assets with a holding period of 5 years
Partial realization likely means dividend distribution, minority equity sales, asset divestitures etc. vs full sale
18/ Private equity secondary AUM as % of total AUM is at an all time high

19/ Secondaries and direct lending are the only two strategies where capital raised is higher vs 5 year average
Venture capital -57% vs 5 year average
Growth equity -35% vs 5 year average
Buyout PE -11% vs 5 year average
Real estate -46% vs 5 year average
Venture capital -57% vs 5 year average
Growth equity -35% vs 5 year average
Buyout PE -11% vs 5 year average
Real estate -46% vs 5 year average

20/ Average size of buyout funds closed dropped roughly 20% y/y

21/ Even more importantly, funds are taking longer to close than before over the past decade

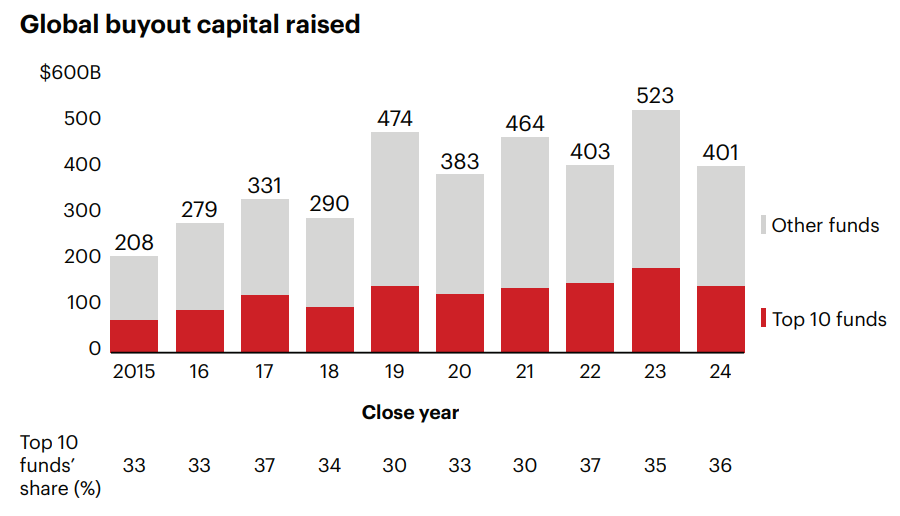
22/ Top 10 funds made up 36% of capital raised in the buyout space, consistent with historical data but starting to trend higher
23/ US buyout IRR starting to converge closer to public markets
European buyout still comfortably outpacing the MSCI Europe index
European buyout still comfortably outpacing the MSCI Europe index

24/ Median entry TEV multiples for technology companies remain higher vs other sectors
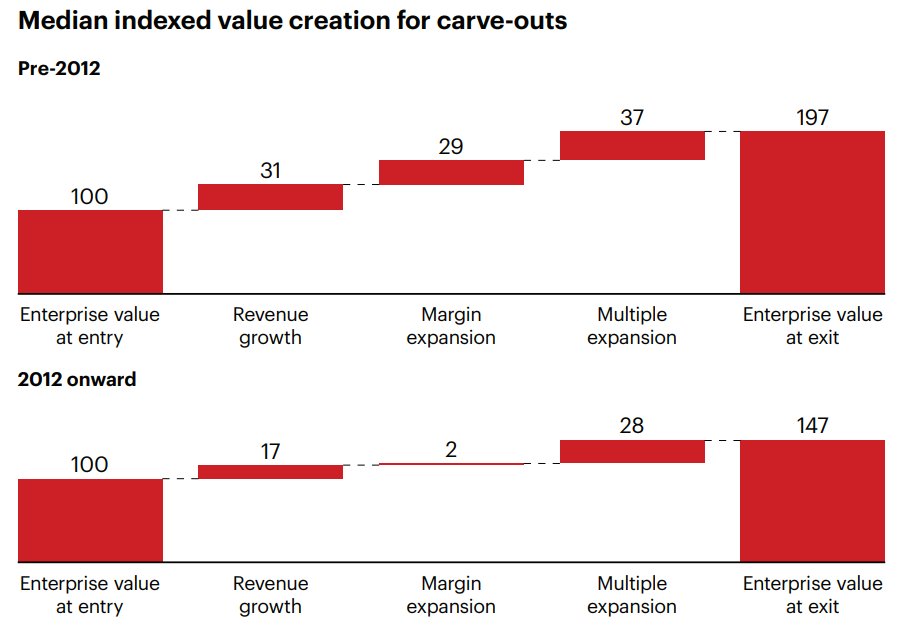
25/ Value creation estimate for private equity carve-out deals for pre-2012 deals vs post-2012 deals
Less overall value generated today with value from margin expansion having compressed the most for post-2012 deals
Less overall value generated today with value from margin expansion having compressed the most for post-2012 deals
• • •
Missing some Tweet in this thread? You can try to
force a refresh