Emil Kirkegaard Profile picture
May 25 12 tweets 4 min read Read on X
Not everybody commit scientific fraud at the same rate. Let's look at some data. First retraction rates. Image
We can also look at the top list of most fraudulent researchers ever (so far those that were caught). Note: data from 2019 list. There's quite a few non-Europeans. Image
This is important because we want a per capita measure of sorts. For highly regarded journals, European built countries produced about 75% of science (Nature Index), but maybe 30% of top fraudsters. Image
Looking at the broader construct of misconduct, we can do the same thing. It seems East Asians commit this about 40x times more than Europeans. Staggering. Image
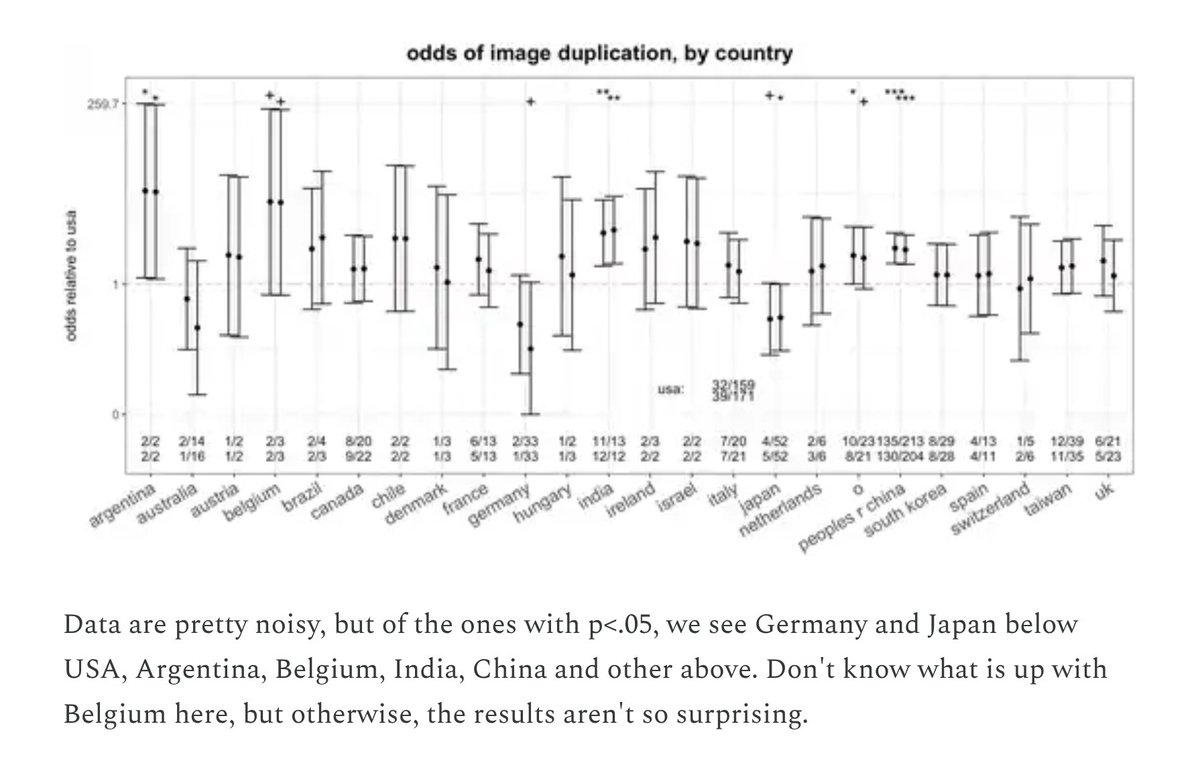
Some clever researchers used scraping to download 1000s studies and looked for studies with duplicated images from other studies. Image
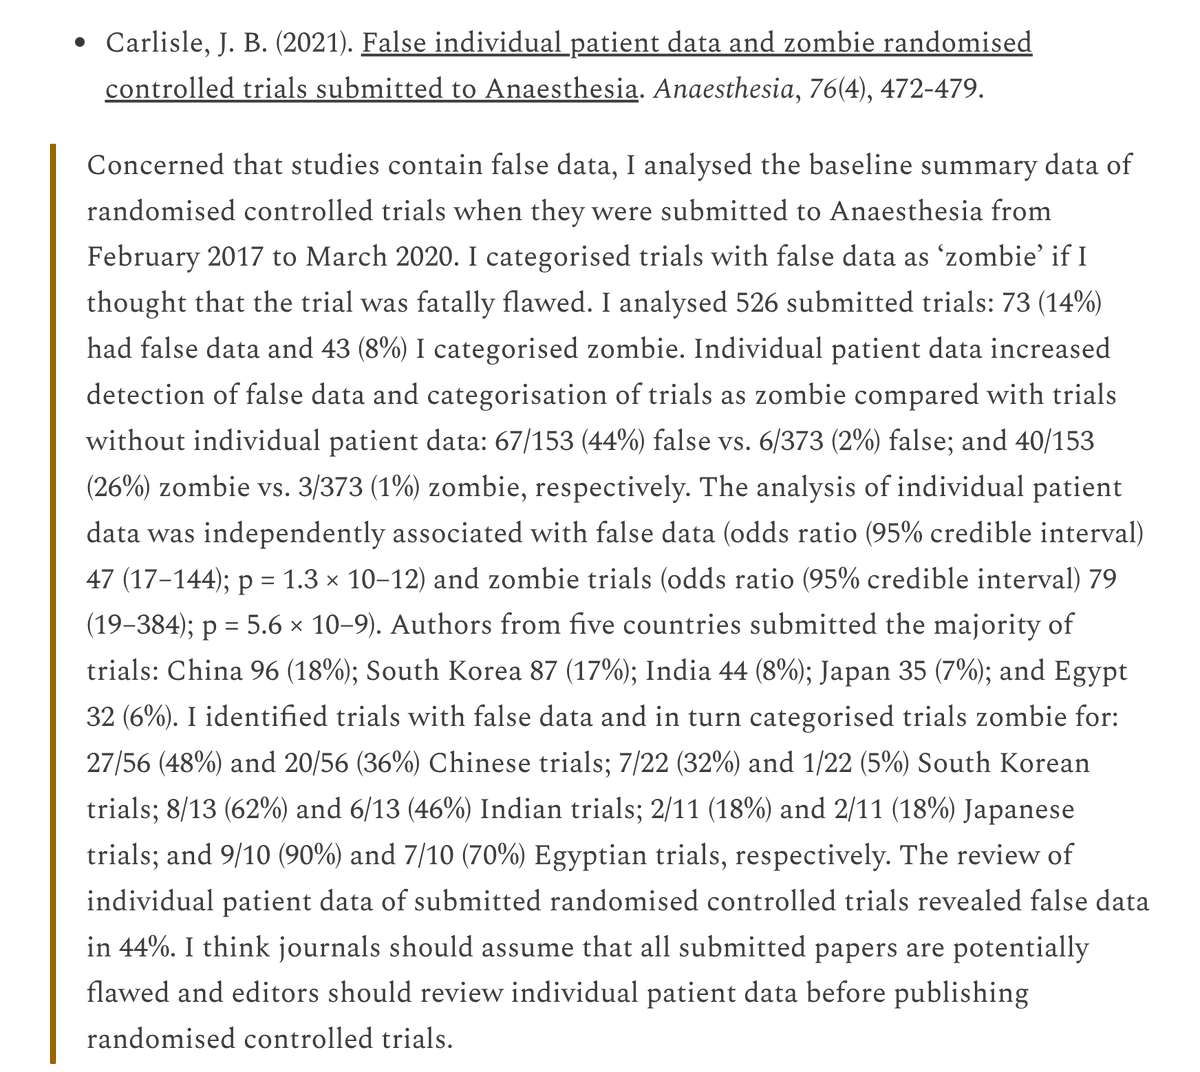
One journal editor went to the unusual step of analyzing the data in submitted papers. This is what he found: Image
Image
Looking beyond science, to other life dishonesty, we may note that in Asia, they make heist-type movies where the object is test cheating. Here, Thailand. Image
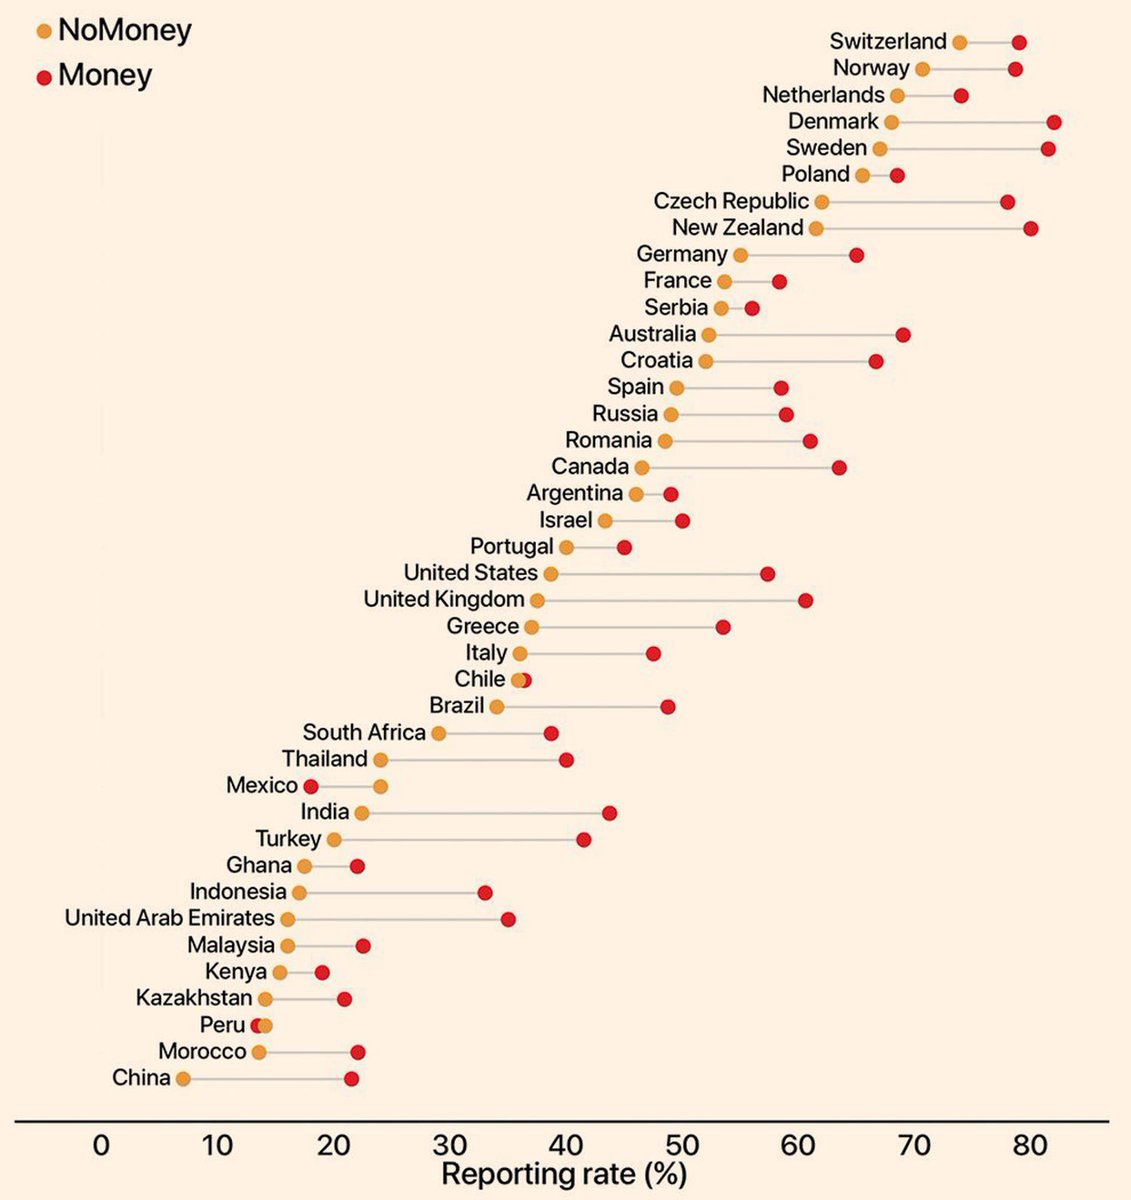
There was the famous wallet study too. Image
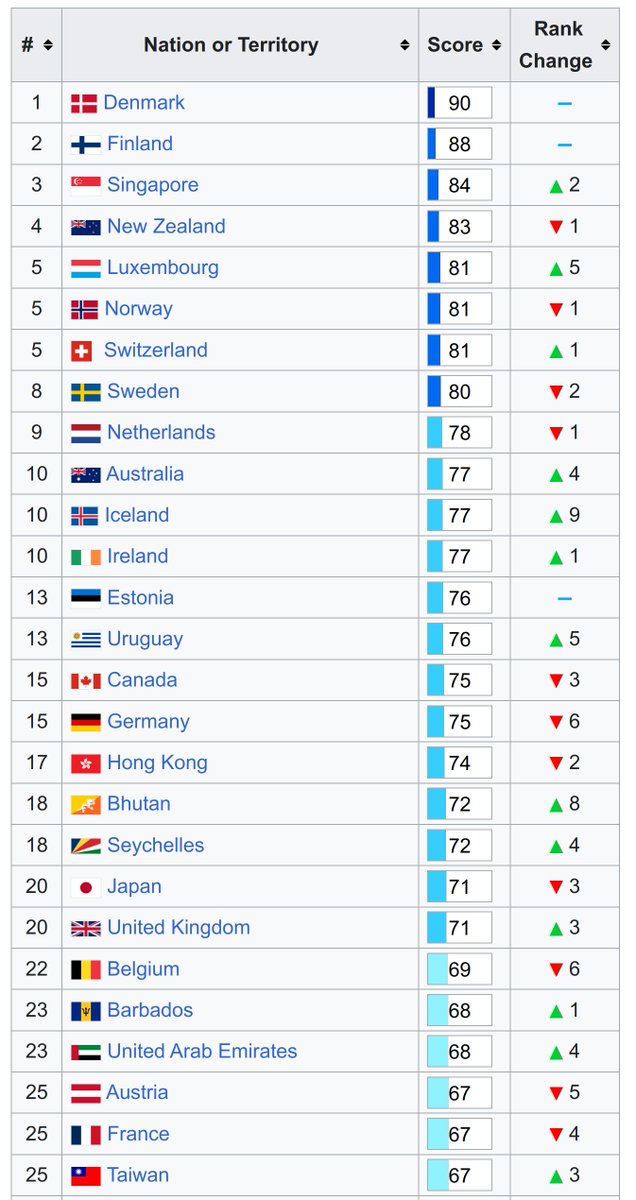
Broader still, corruption index (note Singapore!) Image
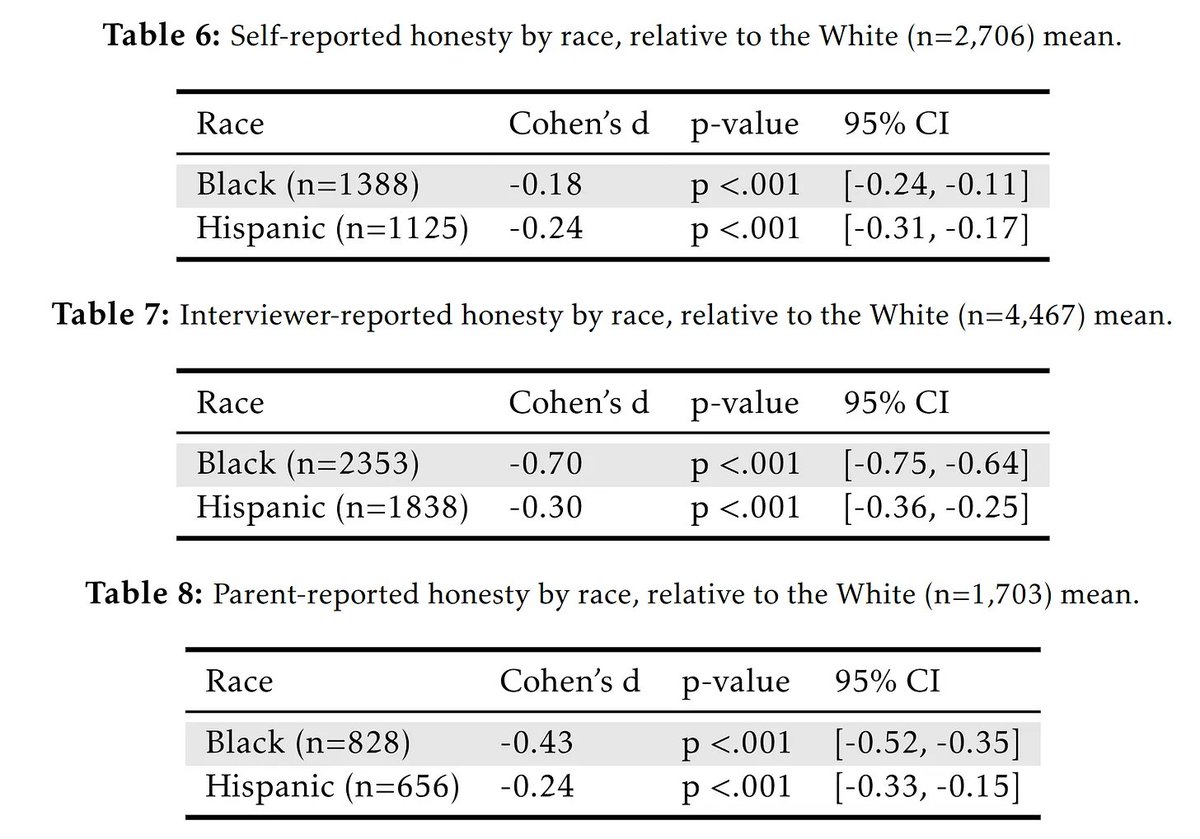
We also studied dishonesty by race in survey data, by self-report, parent-report, and interviewer-report. Too few Asians unfortunately, but the other gaps were seen as expected. Image
• • •

Missing some Tweet in this thread? You can try to force a refresh

 

Keep Current with Emil Kirkegaard

Emil Kirkegaard Profile picture

Stay in touch and get notified when new unrolls are available from this author!

Read all threads

This Thread may be Removed Anytime!

PDF

Twitter may remove this content at anytime! Save it as PDF for later use!

Try unrolling a thread yourself!

how to unroll video
  1. Follow @ThreadReaderApp to mention us!

  2. From a Twitter thread mention us with a keyword "unroll"
@threadreaderapp unroll

Practice here first or read more on our help page!

More from @KirkegaardEmil

May 15
You have maybe seen this plot. It shows ratings of races in USA by race. The key result is that each race favors their own, except for Whites who are apparently race-blind. Image
Since it only covered a single year, 2020, I wondered if this would replicate across years of data. So I downloaded the data for 1964-2024.

So we see that the result replicated (I didn't use survey weights). And indeed, in 2020 and 2024, Whites have about zero ethnocentrism. Image
But this pattern among Whites is more complex. Here are the ratings by political ideology (self-rated 1-7 scale). The below average attitude towards fellow Whites is concentrated on the left, just as @ZachG932 found before. Especially the far left. Image
Image
Read 7 tweets
May 13
Mental issues roughly follow a hierarchical pattern, like cognitive abilities, like a general factor on top. At least, statistically. Image
The motivating factors behind this approach compared to the categorical (diagnostic) approach are: 1) evidence of continuity between clusters, 2) binary encoding of continuous data loses information, 3) correlations among diagnoses are the norm, 4) a given person may not quality for any particular diagnosis, yet have severe symptoms.Image
Some aspects of mental problems haven't been integrated into the hierarchical model yet. Say, unusual sexual interests (from foot fetishes to pedophilia and rape fetishes). Image
Read 7 tweets
May 9
What makes a good computer game?
An analysis of 60k Steam game ratings Image
First ratings were adjusted for small sample bias using empirical Bayes Image
Games seem to be getting better. The higher ratings in the past probably reflect selection bias for which games are listed on Steam. Image
Read 8 tweets
May 1
We just published a study showing that national stereotypes of intelligence are also accurate. It looks like this. Image
You may be able to see that the pattern is quite nonlinear, and a spline test confirms this. Image
But let's step back. We asked ~500 Americans to estimate country's average intelligence from "far below average" to "far above average". Image
Read 9 tweets
Apr 27
It looks like the more women we get into academia, the less of a university it will be and the more of a left-wing emotional playground it will be. Image
Read 4 tweets
Apr 12
US Naval Academy: "a white applicant with a 5% chance of admission would have a 50% chance if evaluated as Black, and more than 70% of Black admits would not have been admitted under a race-neutral system"

Whites the most systematically discriminated against race. Image
The usual SAT gaps among applicants. Image
US military looks like other publicly funded institutions. A jobs program for non-Whites. Image
Read 4 tweets

Did Thread Reader help you today?

Support us! We are indie developers!


This site is made by just two indie developers on a laptop doing marketing, support and development! Read more about the story.

Become a Premium Member ($3/month or $30/year) and get exclusive features!

Become Premium

Don't want to be a Premium member but still want to support us?

Make a small donation by buying us coffee ($5) or help with server cost ($10)

Donate via Paypal

Or Donate anonymously using crypto!

Ethereum

0xfe58350B80634f60Fa6Dc149a72b4DFbc17D341E copy

Bitcoin

3ATGMxNzCUFzxpMCHL5sWSt4DVtS8UqXpi copy

Thank you for your support!

Follow Us!

:(