Mike Hoerger, PhD MSCR MBA Profile picture
Jun 17, 2025 7 tweets 3 min read Read on X
1) PMC COVlD Dashboard, June 16, 2025 (U.S.)

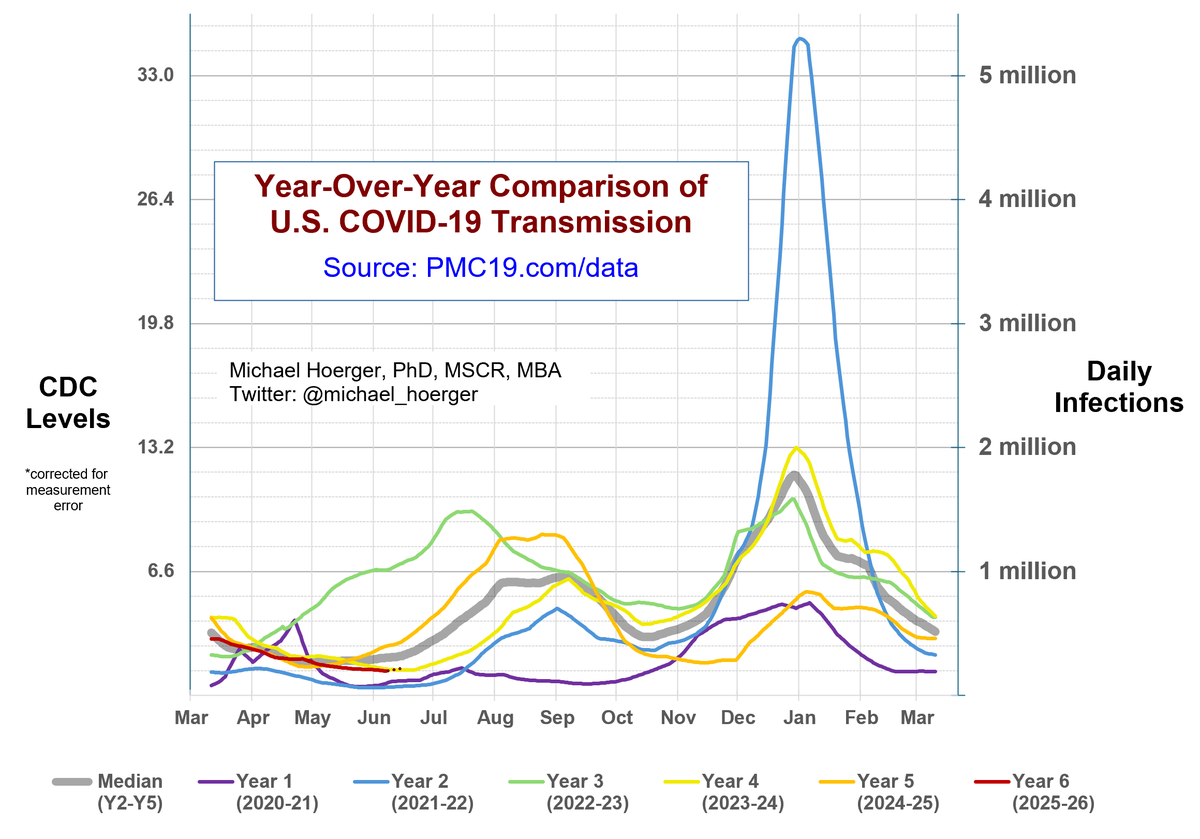
Current transmission (red line) closely tracks that of summer 2023 (yellow line).

We expect to break 500k daily infections between July 9 and the end of July. Our current forecast...Year over year graph of tranmission
2) PMC COVlD Dashboard, June 16, 2025 (U.S.)

Our current forecast is a bit more aggressive, predicting breaking 500k daily infections by July 9. The 2023 trend suggests end of July.

The 95% confidence interval shows large variation. Note that...Past 12 months of transmission (U.S.) and forecast
3) PMC COVlD Dashboard, June 16, 2025 (U.S.)

Note that CDC and Biobot both had retroactive corrections to last week's data, meaning the relative "lull" will last a little longer than the uncorrected data suggested. No big news on NB.1.8.1.

All good news, but...10 pandemic waves. Soon 11
4) PMC COVlD Dashboard, June 16, 2025 (U.S.)

But even in a *relative* "lull," transmission is high by public health metrics. This week's infections may result in >80,000 #LongCovid conditions and >600 excess deaths.

Current transmission is largely...Current Levels for Jun 16, 2025	 % of the Population Infectious	 0.5% (1 in 208)	 New Daily Infections	 230000	 New Weekly Infections	 1610000	 Resulting Weekly Long COVID Cases	 81,000 to 322,000	 Resulting Weekly Excess Deaths	 600 to 1,000	 	 Monthly Forecast	 Average % of the Population Infectious	 0.8% (1 in 120)	 Average New Daily Infections	 398400	 New Infections During the Next Month	 11952000	 Resulting Monthly Long COVID Cases	 598,000 to 2,390,000	 Resulting Monthly Excess Deaths	 4,300 to 7,100	 	 Running Totals	 Infections Nationwide in 2025	 73043000	 Average Number of Infect...
5) PMC COVlD Dashboard, June 16, 2025 (U.S.)

Transmission is largely hitting the South and West to a greater degree currently.

However, notice transmission has been quite 'High' (per CDC) in DC as well. Bad news for those at rallies there.

Note that...C19 heat map using CDC data
6) PMC COVlD Dashboard, June 16, 2025 (U.S.)

Note that people in the West (1 in 141) and South (1 in 172) are much more likely to be infectious than those in the Midwest (1 in 261) and Northeast (1 in 248).

For more detail...CDC regional transmission graph with PMC estimates of the proportion of the population actively infectious, noted in Tweet.
7) PMC COVlD Dashboard, June 16, 2025 (U.S.)

For more detail, check out our graphs & report on the web:

Next week, we will start to roll out a big (non statsy) update that should help with more granular local and international data.

Please share 😷👍pmc19.com/dataFull dashboard, summarized in thread

• • •

Missing some Tweet in this thread? You can try to force a refresh
 

Keep Current with Mike Hoerger, PhD MSCR MBA

Mike Hoerger, PhD MSCR MBA Profile picture

Stay in touch and get notified when new unrolls are available from this author!

Read all threads

This Thread may be Removed Anytime!

PDF

Twitter may remove this content at anytime! Save it as PDF for later use!

Try unrolling a thread yourself!

how to unroll video
  1. Follow @ThreadReaderApp to mention us!

  2. From a Twitter thread mention us with a keyword "unroll"
@threadreaderapp unroll

Practice here first or read more on our help page!

More from @michael_hoerger

Apr 6
PMC COVlD Update, April 6, 2026

Transmission is stable in a relative "lull" nationally between waves.

We estimate that approximately 313,000 people are still getting infected per day, with outbreaks radiating from TN and MS.

🧵1 of 10 (don't miss #10)! Heat map with PMC estimates
With limited data reported, Mississippi has an estimated 1 in 27 residents actively infectious.

In a room of 25 people, that's a 61% chance of exposure, if no testing/isolation protocols.

🧵2 of 10 Alabama	Low Alaska	Very Low Arizona	Very Low* Arkansas	Low California	Very Low Colorado	Very Low Connecticut	Low Delaware	Low District of Columbia	Very Low Florida	Very Low Georgia	Low Guam	Low Hawaii	Very Low Idaho	Very Low Illinois	Very Low Indiana	Very Low Iowa	Very Low Kansas	Low Kentucky	Moderate Louisiana	Moderate Maine	Very Low Maryland	Low Massachusetts	Very Low Michigan	Low Minnesota	Very Low Mississippi	Very High*
1 in 24 people in Tennessee are estimated to be actively infectious with SARS-CoV-2. That's a 65% chance of exposure in a room of 25 people where nobody is testing/isolating.

🧵3 of 10 Missouri	Moderate* Montana	Very Low Nebraska	Very Low Nevada	Very Low New Hampshire	Very Low New Jersey	Low New Mexico	Very Low New York	Very Low North Carolina	Low North Dakota	Very Low* Ohio	Very Low Oklahoma	Low* Oregon	Very Low Pennsylvania	Low Rhode Island	Very Low South Carolina	Very Low South Dakota	Low Tennessee	Very High Texas	Low Utah	Very Low Vermont	Moderate Virginia	Moderate Washington	Very Low West Virginia	Low Wisconsin	Very Low Wyoming	Very Low
Read 10 tweets
Apr 3
This is an unethically misleading study with findings easily explained by residual confounding. Some health systems and patients have thorough record keeping. Others don't. All sorts of variables will correlate (infections, cancers, anything else tracked in medical records).
This is a really obvious issue for an international epi study. It should not have been published.
The above study is using the same processes the anti-vaxxers use -- junk epi that does not account for confounding -- to support whatever pre-conceived notions the authors have, with absurdly large effects.

Read 4 tweets
Mar 23
PMC #COVID Update, March 23, 2026 (U.S.)

Transmission levels have plummeted nationally as we shift from the 12th wave toward a relative "lull."

Over half the states have "Very Low" relative transmission, per the CDC.

🧵THREAD 1 of 8 Heat map using CDC levels and PMC estimate of prevalence (1 in 147 actively infectious nationwide).
Transmission varies considerably by state.

Highest
🔥Mississippi: 1 in 31 estimated actively infectious
🔥Michigan: 1 in 41
*Both states w/limited data though

Rates are quite low in relative terms in California, AZ, FL, HI, ID, MA, NV, NY, OR, RI, UT, WI

🧵THREAD 2 of 8 Alabama	Very Low Alaska	Very Low Arizona	Very Low Arkansas	Low* California	Very Low Colorado	Very Low Connecticut	Low Delaware	Moderate District of Columbia	Low Florida	Very Low Georgia	Very Low Guam	Very Low Hawaii	Very Low Idaho	Very Low Illinois	Very Low Indiana	Low Iowa	Moderate Kansas	Low Kentucky	Moderate Louisiana	Low Maine	Very Low Maryland	Moderate Massachusetts	Very Low Michigan	High* Minnesota	Moderate Mississippi	High* Missouri	Low Montana	Very Low Nebraska	Low Nevada	Very Low New Hampshire	Low* New Jersey	Low New Mexico	Very Low New York	Very Low North Carolina	Low North Dakota...
The 6th anniversary of the WHO's pandemic declaration was March 11.

Bots, minimizers, & individuals' psychological defense mechanisms will downplay that.

Yet, the U.S. just had a 12th wave. We estimate >5 cumulative infections/person & ongoing health harms.

🧵THREAD 3 of 8 Graph of the 12 waves of the pandemic (U.S.)
Read 8 tweets
Mar 14
As of today, the COVID-19 pandemic is now longer than WWII.
If you have been living in denial the past 6 years, know that the U.S. is winding down from a 12th wave of infections presently.
Denial is but one of several obvious defense mechanisms people use to try to block their awareness of the ongoing toll of COVID-19. There are many others.

Short-term capital also plays a role, but even that requires a large dose of defense mechanisms.

Read 7 tweets
Jan 25
During this 12th COVlD wave, the CDC reports 1-in-3 states have "High" or "Very High" levels.

PMC estimates the proportion of residents actively infectious (prevalence):
◾️USA: 1 in 67
◾️IA: 1 in 27
◾️MI: 1 in 25
◾️IN & CT: 1 in 23
◾️ME: 1 in 21
◾️OK & SD: 1 in 17

🧵1/ Heat map using CDC data. National PMC prevalence estimate noted; estimated incidence of 732,000 new daily infections.
On average, Americans have have 5.0 cumulative SARS-CoV-2 infections.

This week's infections are expected to result in 1/4 to 1 million new #LongCOVID conditions and ≈2,000 excess deaths.
🧵2/ Column 1: Table of state-level prevalence estimates. Highest estimates noted in the thread text.  Column 2:  Proportion Actively Infectious										1 in 67 (1.5%) New Daily Infections										 732,000  Infections the Past Week										 5,220,000  Infections in 2026										 24,000,000  Cumulative Infections per Person										 5.04  										 Long COVID										 Long COVID Cases Resulting								37,000 to 146,000		   from New Daily Infections										 Long COVID Cases Resulting								261,000 to 1,040,000		   from New Weekly Infections										 										 Excess Deaths										 Ex...
The wave peak is now estimated >10% higher than last week at 1.2 million new daily infections, nearly double the Delta wave.

We expect sustained high transmission (≈600,000 to 750,000 new daily infections) the next few weeks as COVlD circulates through schools/families.
🧵3/ Fig 1: Graph of 12 waves  Fig 2: "Barometer" showing above average transmission  Fig 3: Year-over-year graph, which informs the analytic forecast  Fig 4: Forecast described in post
Read 4 tweets
Jan 17
Based on today's CDC & Biobot data, we estimate the following for the week of Jan 19:

🔸1 in 52 people in the U.S. actively infectious
🔸25% chance of exposure in a room of 15 ppl
🔸Nearly 1 million new daily infections
🔸5 cumulative infections per person all-time (avg)
🧵1/5 Heat map from CDC data with PMC estimates. Description of "Very High" states in next post
Transmission estimates have been marginally corrected upward.

11 states have Very High COVlD levels:

🔸PA: 1 in 25 estimated actively infectious
🔸MI: 1 in 23
🔸OH & KY: 1 in 22
🔸SD: 1 in 20
🔸NE & IA: 1 in 18
🔸IL & ME: 1 in 17
🔸IN: 1 in 16
🔸WV: 1 in 11
🧵2/5 Proportion Actively Infectious										1 in 52 (1.9%) New Daily Infections										 941,000  Infections the Past Week										 6,020,000  Infections in 2026										 18,000,000  Cumulative Infections per Person										 5.01  										 Long COVID										 Long COVID Cases Resulting								47,000 to 188,000		   from New Daily Infections										 Long COVID Cases Resulting								301,000 to 1,200,000		   from New Weekly Infections										 										 Excess Deaths										 Excess Deaths Resulting 									270 to 450	   from New Daily Infections										 Excess Deaths Resulting 				...
We're in the middle of a 12th COVlD wave.

The peak has likely passed, but with students headed back to school, transmission is expected to remain high for at least the next several weeks.

🧵3/5 1) Graph of 12 waves 2) Barometer showing above-average transmission 3) Year over year graph 4) Forecast for transmission to decline and then percolate at high levels
Read 5 tweets

Did Thread Reader help you today?

Support us! We are indie developers!


This site is made by just two indie developers on a laptop doing marketing, support and development! Read more about the story.

Become a Premium Member ($3/month or $30/year) and get exclusive features!

Become Premium

Don't want to be a Premium member but still want to support us?

Make a small donation by buying us coffee ($5) or help with server cost ($10)

Donate via Paypal

Or Donate anonymously using crypto!

Ethereum

0xfe58350B80634f60Fa6Dc149a72b4DFbc17D341E copy

Bitcoin

3ATGMxNzCUFzxpMCHL5sWSt4DVtS8UqXpi copy

Thank you for your support!

Follow Us!

:(