Toronto Housing vs Gold: The Shocking Truth 🧵
🏠💰 THREAD:
I analyzed 20 years of CREA MLS data and what I found will blow your mind...
Toronto home prices in GOLD reveal the biggest monetary illusion of our time.
🏠💰 THREAD:
I analyzed 20 years of CREA MLS data and what I found will blow your mind...
Toronto home prices in GOLD reveal the biggest monetary illusion of our time.

The Numbers:📊 2005: $335k = 558 oz of gold
📊 2022 PEAK: $1.27M = 267 oz of gold
📊 2025: $1M = 217 oz of gold
That's a 61% COLLAPSE in real purchasing power!
🤯
Toronto Real Estate Prices in Gold 👇
📊 2022 PEAK: $1.27M = 267 oz of gold
📊 2025: $1M = 217 oz of gold
That's a 61% COLLAPSE in real purchasing power!
🤯
Toronto Real Estate Prices in Gold 👇

Wait, but didn't home prices TRIPLE?
Yes, in Canadian dollars:
2005: $335k CAD
2022 Peak: $1.27M CAD (+279%!)
2025: $1M CAD (+199%)
But here's the monetary earthquake... 💸
Yes, in Canadian dollars:
2005: $335k CAD
2022 Peak: $1.27M CAD (+279%!)
2025: $1M CAD (+199%)
But here's the monetary earthquake... 💸

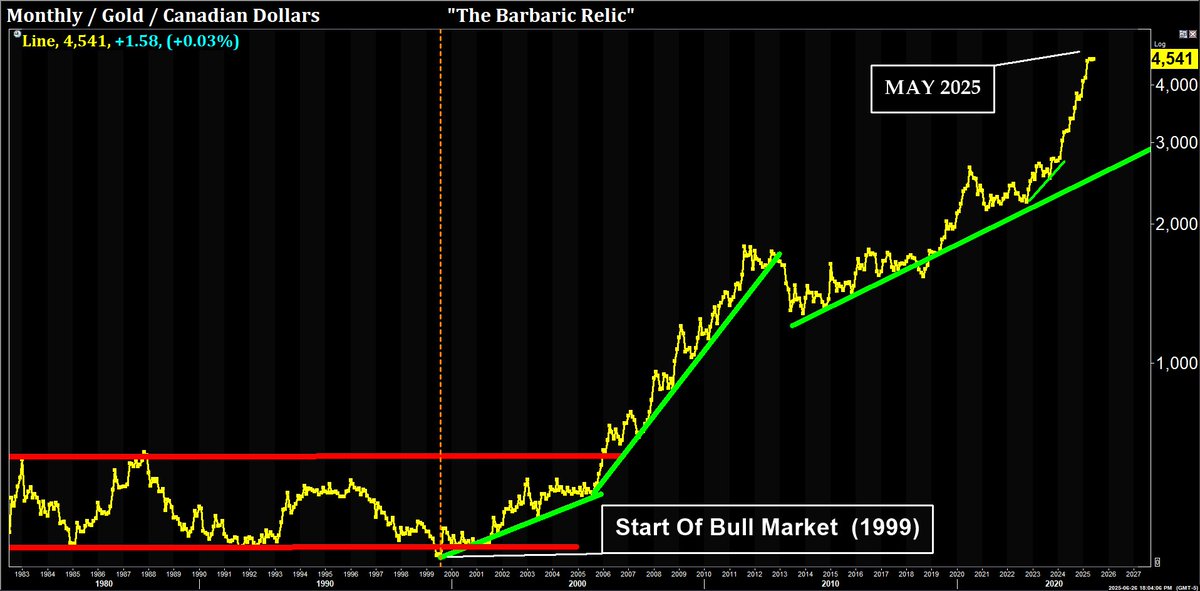
Gold revealed the REAL story:
2005: $600 CAD/oz
2022: $4,755 CAD/oz
2025: $4,613 CAD/oz (+668%!)
Gold didn't "go up" - the Canadian dollar collapsed through massive credit expansion! 📉
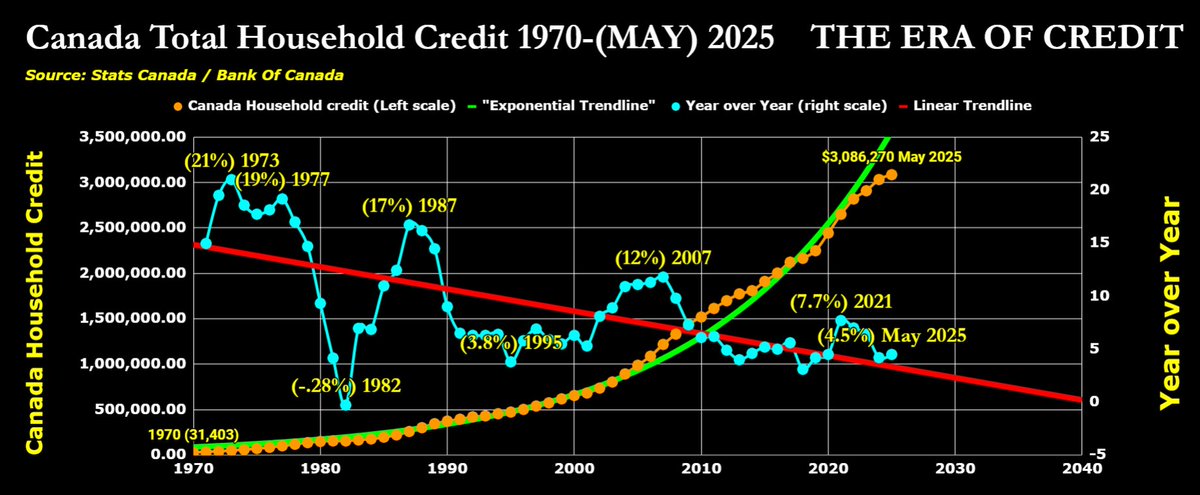
The Bank of Canada inflated M2 money supply by ~300% since 2005! 🏦
2005: $600 CAD/oz
2022: $4,755 CAD/oz
2025: $4,613 CAD/oz (+668%!)
Gold didn't "go up" - the Canadian dollar collapsed through massive credit expansion! 📉
The Bank of Canada inflated M2 money supply by ~300% since 2005! 🏦

The 2022 peak was peak delusion 🎢
At $1.27M, that house was "worth" only 267 oz of gold - ALREADY a 52% real decline from 2005!
Today at $1M, it's down 61% in real terms.
The "wealth" was always a monetary mirage! 🏜️
At $1.27M, that house was "worth" only 267 oz of gold - ALREADY a 52% real decline from 2005!
Today at $1M, it's down 61% in real terms.
The "wealth" was always a monetary mirage! 🏜️

Even MORE shocking:
A $335k house that cost 558 oz of gold in 2005 now costs only 217 oz at $1M.
Homeowners lost over HALF their purchasing power even during the biggest "boom" in history! 📉
The nominal gains masked devastating real losses.
A $335k house that cost 558 oz of gold in 2005 now costs only 217 oz at $1M.
Homeowners lost over HALF their purchasing power even during the biggest "boom" in history! 📉
The nominal gains masked devastating real losses.

This is textbook Kondratieff Wave economics 🌊
We witnessed the final phase of the 4th wave's credit super-cycle:
2005-2015: Credit expansion phase
2016-2022: Mania/blow-off top
2022-now: Early winter/deflation begins
Real estate bubbles ALWAYS precede Kondratieff winters ❄️
We witnessed the final phase of the 4th wave's credit super-cycle:
2005-2015: Credit expansion phase
2016-2022: Mania/blow-off top
2022-now: Early winter/deflation begins
Real estate bubbles ALWAYS precede Kondratieff winters ❄️
The socioeconomic forces were powerful 👥
Social media amplified FOMO and wealth signaling
Ultra-low rates made speculation feel "safe"
Immigration created artificial scarcity narrative
Financial illiteracy masked currency debasement
But it was ALL built on credit expansion, not real wealth creation! 💸
Social media amplified FOMO and wealth signaling
Ultra-low rates made speculation feel "safe"
Immigration created artificial scarcity narrative
Financial illiteracy masked currency debasement
But it was ALL built on credit expansion, not real wealth creation! 💸
The brutal mathematical truth:
$335k → $1M looks like incredible wealth creation (+199%)
558oz → 217oz reveals devastating purchasing power destruction (-61%)
Even the "peak" at $1.27M meant you'd already lost 52% of your real wealth! 📊
$335k → $1M looks like incredible wealth creation (+199%)
558oz → 217oz reveals devastating purchasing power destruction (-61%)
Even the "peak" at $1.27M meant you'd already lost 52% of your real wealth! 📊

What's next in Kondratieff winter? ❄️
Continued credit contraction
Asset prices deflating toward sound money values
The great repricing back to real fundamentals
Currency debasement chickens coming home to roost
Gold holders understood monetary history.
Paper asset holders got schooled. 📚
Continued credit contraction
Asset prices deflating toward sound money values
The great repricing back to real fundamentals
Currency debasement chickens coming home to roost
Gold holders understood monetary history.
Paper asset holders got schooled. 📚
The greatest "real estate boom" in Canadian history was actually a 61% wealth destruction event when measured in honest money (#Gold).
$1M homes that used to cost 558oz now cost 217oz.
The gains were pure monetary illusion.
Currency debasement ≠ wealth creation.
$1M homes that used to cost 558oz now cost 217oz.
The gains were pure monetary illusion.
Currency debasement ≠ wealth creation.
• • •
Missing some Tweet in this thread? You can try to
force a refresh