CJ Profile picture
Jul 19 4 tweets 2 min read Read on X
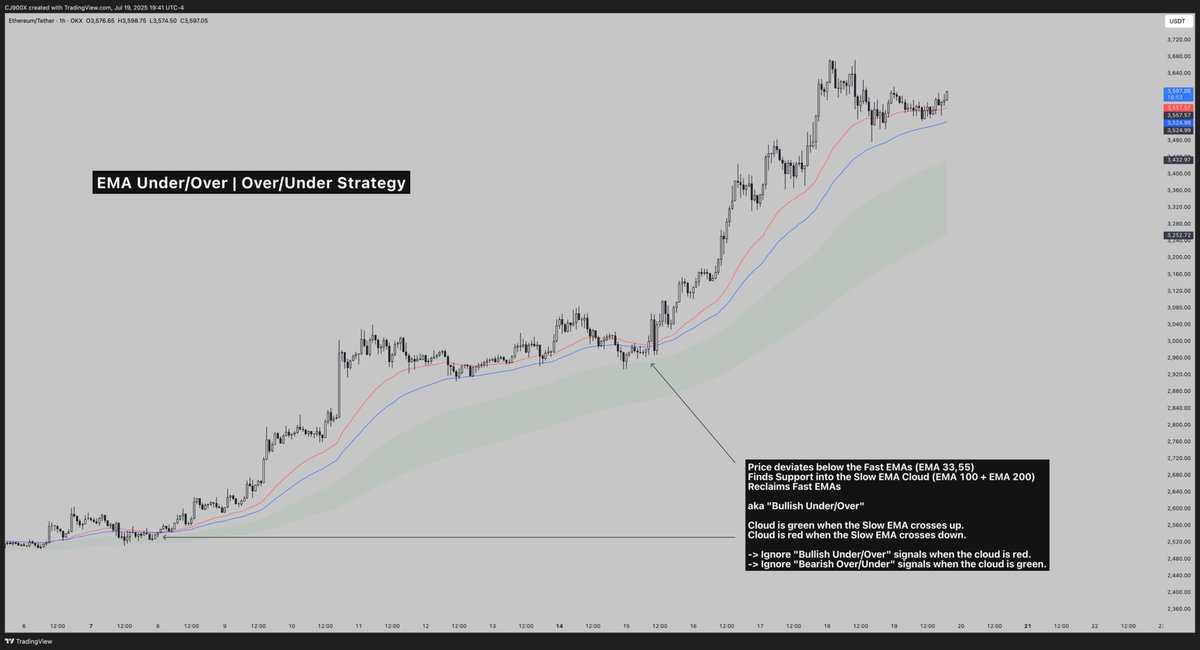
I am a price action maxi at heart, but it's difficult to beat a simple EMA strategy when price is trending.

This is my go-to EMA strategy, which can be used on any timeframe.

Enjoy

Fast EMAs: 33,55
Slow EMAs: 100,200 (cloud) Image
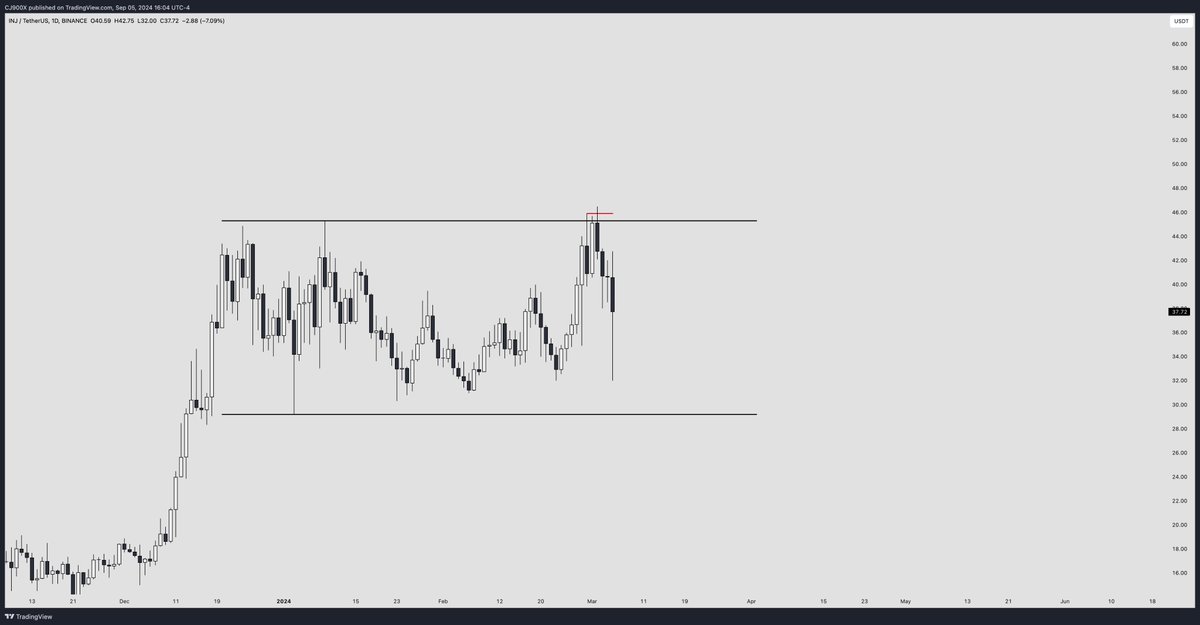
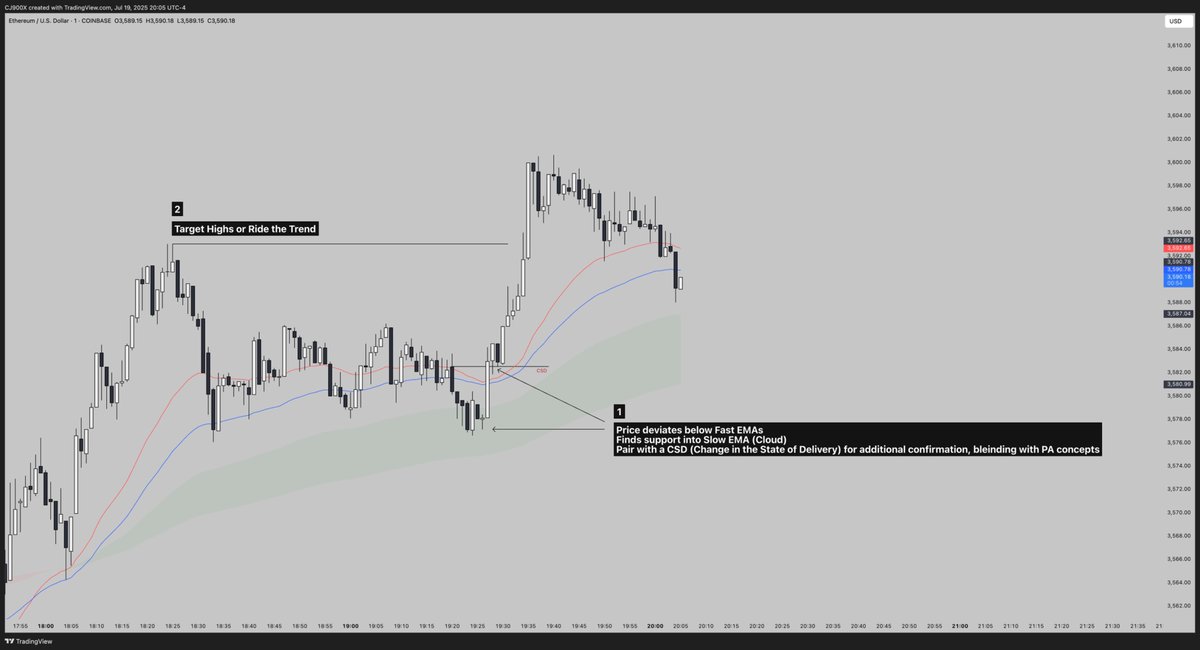
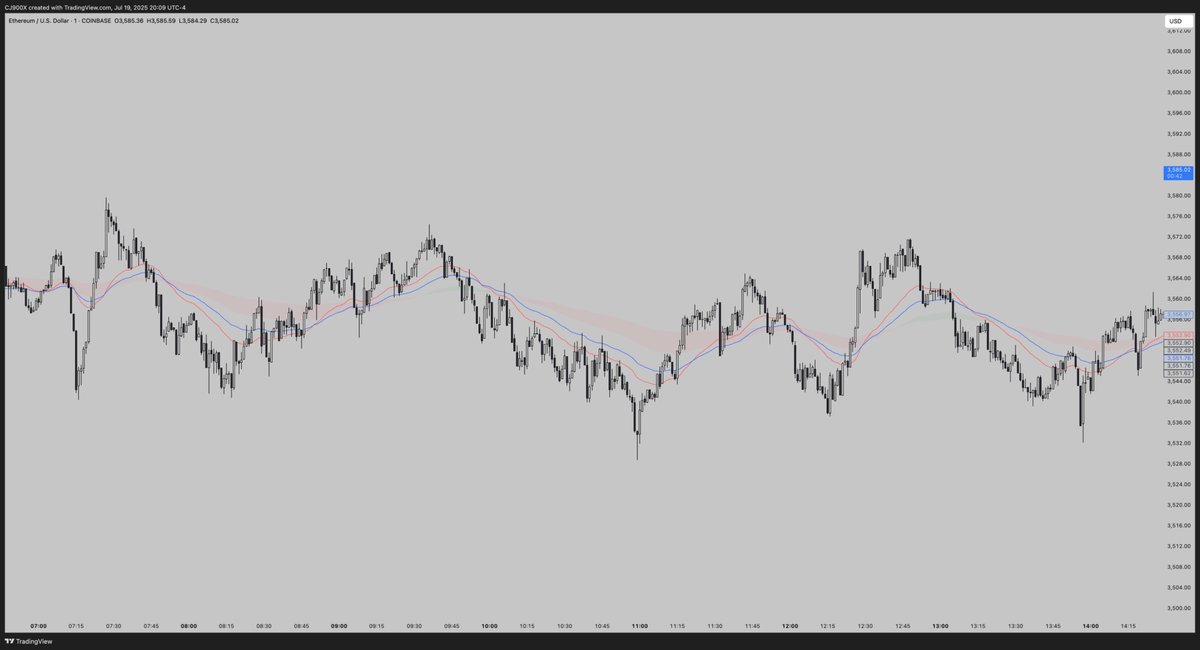
Just switched to the 1 minute timeframe to see if there was a setup, to prove that this can work on any timeframe and here you go.

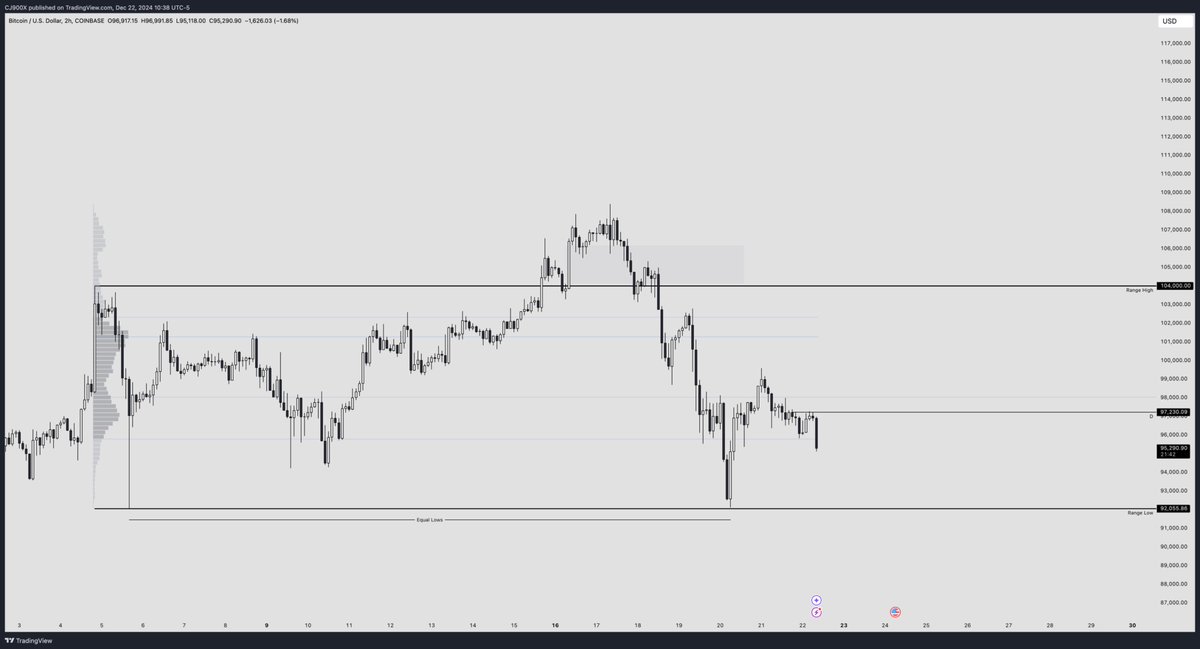
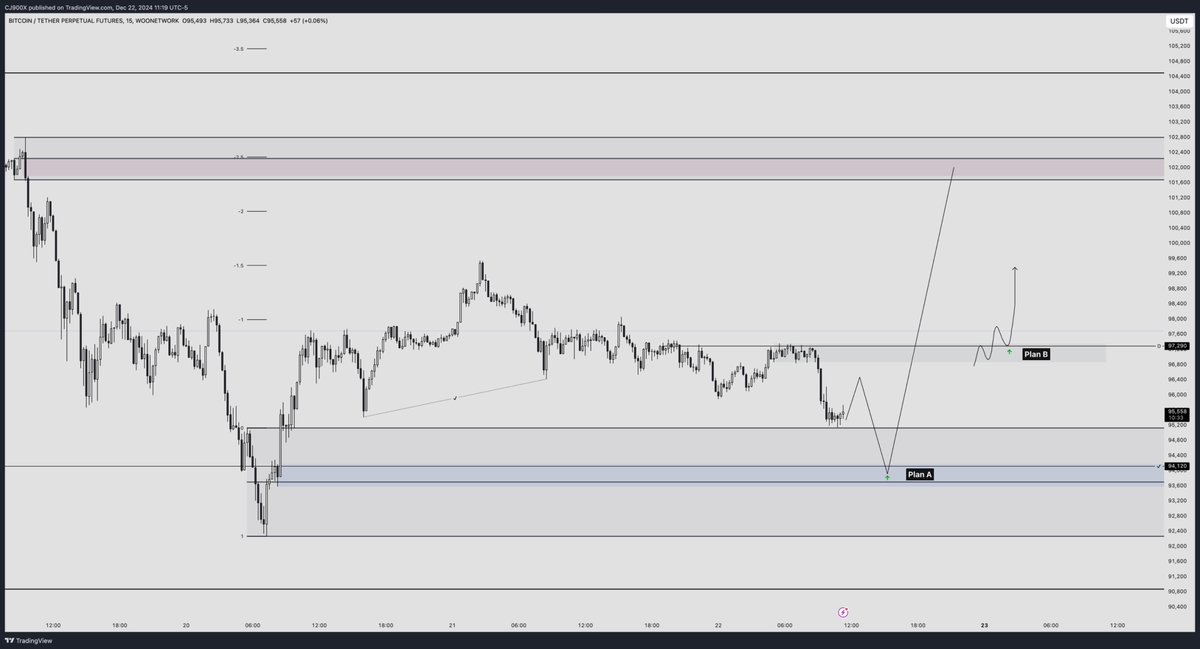
Keep in mind this isn't magic, long signals work best when the HTF is bullish.

Additionally, when price starts to range, EMA strategies aren't great as they chop around from bullish to bearish.

But hopefully you get the idea with the examples. The example below would have captured 3-4R.

GLImage
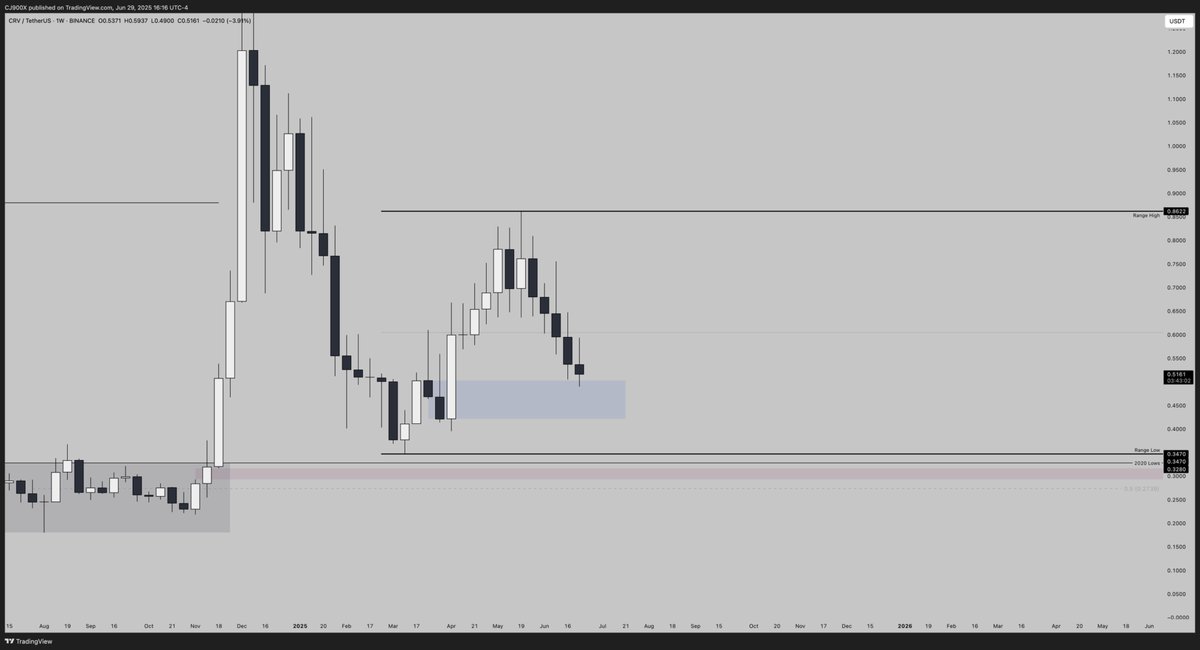
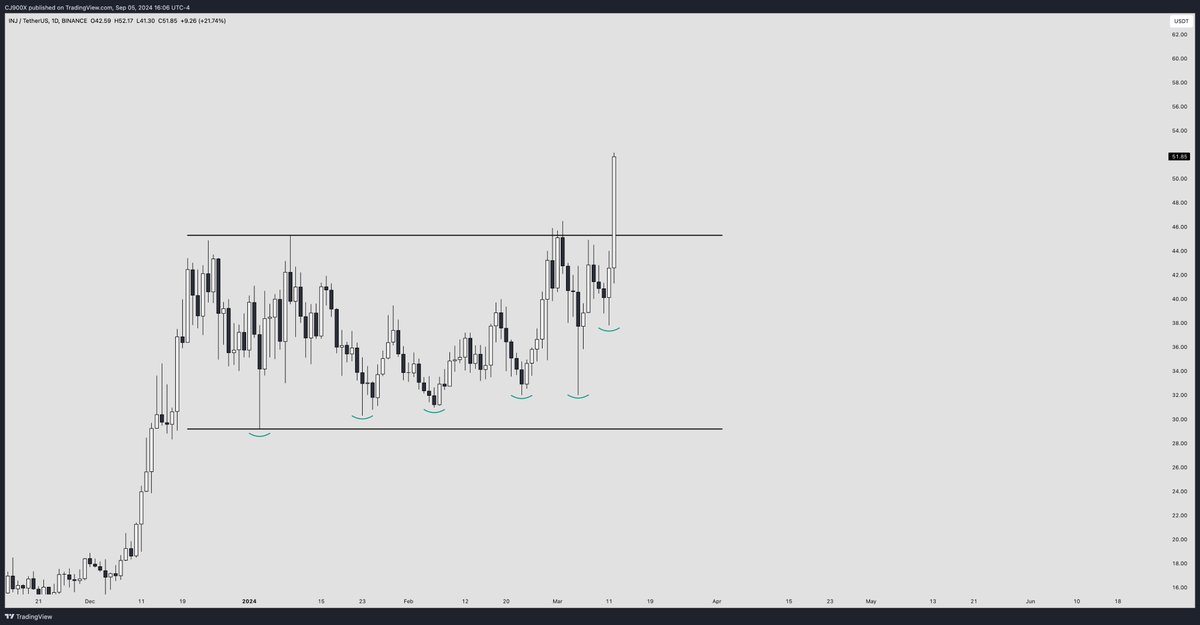
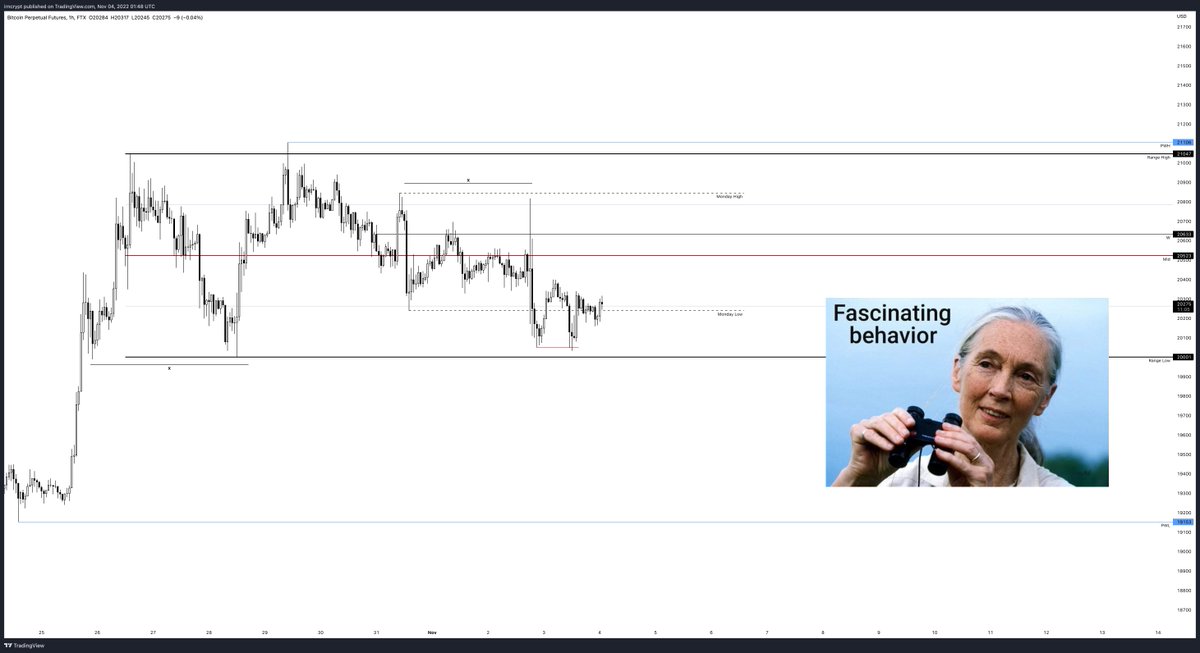
Example of when NOT to use it - price is ranging and the EMA cloud is switching from bearish to bullish frequently.

Just don't force anything. Wait until the setup looks too good not to take, in line with your higher timeframe bias. Image

• • •

Missing some Tweet in this thread? You can try to force a refresh
 

Keep Current with CJ

CJ Profile picture

Stay in touch and get notified when new unrolls are available from this author!

Read all threads

This Thread may be Removed Anytime!

PDF

Twitter may remove this content at anytime! Save it as PDF for later use!

Try unrolling a thread yourself!

how to unroll video
  1. Follow @ThreadReaderApp to mention us!

  2. From a Twitter thread mention us with a keyword "unroll"
@threadreaderapp unroll

Practice here first or read more on our help page!

More from @CJ900X

Jun 29
$CRV - Top Down

Monthly

- We had a deviation below the 2020 lows last year from June to October, with expansion back above during the election rally from November - December.

- I will assume the deviation below the 2020 lows and reclaim is iron support and therefore any re-test should hold.

- The 2025 price action for CRV has been pretty underwhelming. December closed with a large wick to the upside and January re-tested near 50% of said wick, following with a strong move to the downside, testing the .886 fib retrace level. We have since been ranging.

Given the current monthly structure, I cannot confidently say the lows at .34 and .39 are safe because of the currently monthly three candle structure and the likelihood of us closing the month through a fair value gap.

Does this mean I'm bearish on CRV from a monthly perspective? No. I think if we are in a macro accumulation phase for alts and the likes of CRV that has the stable coin narrative behind it, it is perhaps "cheap" here if you have a 6 month time horizon. When price is ranging or in an accumulation phase, deep retracements are to be expected, until we enter markup and expand from these levels. I'm not the account to convince you to buy and hold CRV here based on fundamentals - I'm simply looking at raw technicals. We could be forming a higher low here - but from the monthly pov and the reasons above, I think the lows are not safe yet. I would look at this as opportunity if said lows get run, however.Image
Monthly - Range

So with the above post out of the way and setting the scene for CRV, how do we trade this?

Recap:
We're likely still in an accumulation phase, so ranging price action is to be expected. Low may *or may not* be in yet. Point is -imo- lows are vulnerable. Monthly iFVG to consider.

So let's tidy up the chart and look at the current monthly range (based on swing points).

1. Range High @ 0.8622
2. Range Low @ 0.3470
3. MT of 2020 low deviation @ 0.2739

Monthly Long Thesis:

- Would look to position long / buy spot on a sweep and reclaim of Range Low.
- Lowest expectation of a wick would be to the mean threshold (MT) of the 2020 deviation.Image
Weekly

Not much to add since the monthly timeframe gave us plenty to work with. Note how price is reacting to the mid point of the current range - useful pivot point to keep in mind.

I've also marked out weekly demand, which may provide short term long opportunities. I think from this level, we bounce but the question will this be a bounce into a lower high before running the monthly range low, or does the low form here?

For setups we need to look at a lower timeframe ...Image
Read 8 tweets
Dec 22, 2024
$BTC

Reclaim the daily open for a long towards 102.3k.

Otherwise, I'm watching those Coinbase equal lows. Image
$BTC - LTF

Seems to be only Coinbase with these equal lows. Most other major exchanges ran this level (though there are more equal lows further down).

So I'll keep the CB lows in mind, but here's my low timeframe plan.

We've had a bullish shift on the H4 so I think the nuke from the other day is safe for now. We've also ran a bunch of internal lows too.

I'll long into this m15 demand zone *or* on a clear reclaim of today's open. I want to see a rounded re-test or clear acceptance above 97.3k for Plan B.Image
$BTC

Update

We're into the action area. Want to see if we get a response from the blue demand zone or not.

Might not be around to trade it if we nuke during Asia sessions. Happy to wait to see what presents tomorrow. etc no rush. Image
Read 9 tweets
Sep 5, 2024
Memes and hand wavey squiggly price scenarios aside, here is something actionable to help you navigate a false breakout.

For each scenario, imagine price has been consolidating in a ranging type structure for a period of time, prior to a breakout attempt to the upside, using a bullish example.

From experience, there are three types of false breakouts:

1. The Sweep

Quite simply, price breaks out of the range to the upside but fails to close outside the range, leaving a quick. Consider upside liquidity swept. Price is then likely to gravitate to the other side of the range.

2. The Deviation

Price manages to break out of the range for a short period of time, however doesn't manage to make any significant progress to the upside, before trading back inside the range. You can treat the deviation as your invalidation when entering shorts, again targeting the opposite side of the range.

3. The ******* **** ***

In this scenario, price makes a true break of the range with a close above, with strength and a good amount of travel. This is the scenario I want to focus on the most as it catches a lot of people out - and there are plenty examples of 1 and 2.

To illustrate, let's look at $INJ around Feb/March time of this year.

Keep in mind, INJ was one of the best performing assets of the bull market since January 2023. There was much anticipation of upside especially after 2 months of consolidation.

This is what INJ looked like pre-breakout in February:Image
Breakout Attempt #1

The Sweep

Range High Swept. Then Swept Again. Before closing back into the range. Target Mid-Range and then Range Low (we managed just below mid-range before holding) Image
Breakout Attempt #2

True Breakout?

This was seen by many, including myself at the time, as a potential true breakout of the 2 month long range after an initial fake-out. INJ was able to maintain the higher low structure, despite the initial range high rejection, before putting in a +61% move off the low and managing to *close* outside of the range. No reason to be bearish here.Image
Read 9 tweets
Nov 4, 2022
I and many others often talk about trade plans and scenarios in terms of conditional statements. IF X happens THEN do Y. However, many forget about the ELSE.

Your ELSE scenario is important as it can help you get back into the market if you are sidelined.
For example, let's say your 'IF X happens' is an 80% probability setup. You're waiting for it but BOOM doesn't trigger. Market turns in the opposite direction. You can sit there flat ... OR ... your ELSE condition can get you in on a setup in the opposite direction.
The point of this is your analysis can be wrong, a lot of the time, but you must be humble enough to ignore what you ideally WANTED to happen, and have plans that can trigger whatever direction the market takes. In the spirit of maximising opportunities and profitability.
Read 7 tweets
Nov 4, 2022
#BTC

Possibly reclaiming Monday's low after a sweep of yesterday's low.

Equal highs at Mon High. Should be interesting. Otherwise, still waiting on a visit to 19.7-8k

Gn ✌️
Diagonal looks ripe for a squeeze tbh
Read 4 tweets
Nov 4, 2022
Think $REN gets a pop here.

Swept local highs, held quarter range + H4 EMA 200.

Targeting those equal highs into mid-range
Invalidation < 0.117

As this would break the local diagonal & H4 EMA 200.
$REN 🍾

There's the pop. H4 EMA 200 holding nicely as we compressed within this consolidation, straight into mid-range and taking out equal highs. Not sure if we keep going or pull back but imo further upside is the more likely scenario - want to see mid-range flipped to support
Read 7 tweets

Did Thread Reader help you today?

Support us! We are indie developers!


This site is made by just two indie developers on a laptop doing marketing, support and development! Read more about the story.

Become a Premium Member ($3/month or $30/year) and get exclusive features!

Become Premium

Don't want to be a Premium member but still want to support us?

Make a small donation by buying us coffee ($5) or help with server cost ($10)

Donate via Paypal

Or Donate anonymously using crypto!

Ethereum

0xfe58350B80634f60Fa6Dc149a72b4DFbc17D341E copy

Bitcoin

3ATGMxNzCUFzxpMCHL5sWSt4DVtS8UqXpi copy

Thank you for your support!

Follow Us!

:(