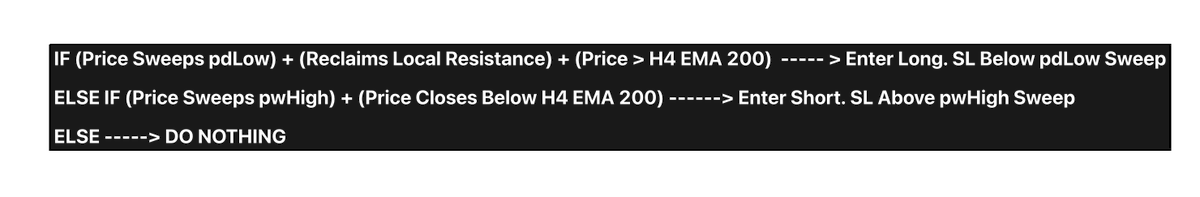
 Indicator:
  Looking for this ideally from earlier
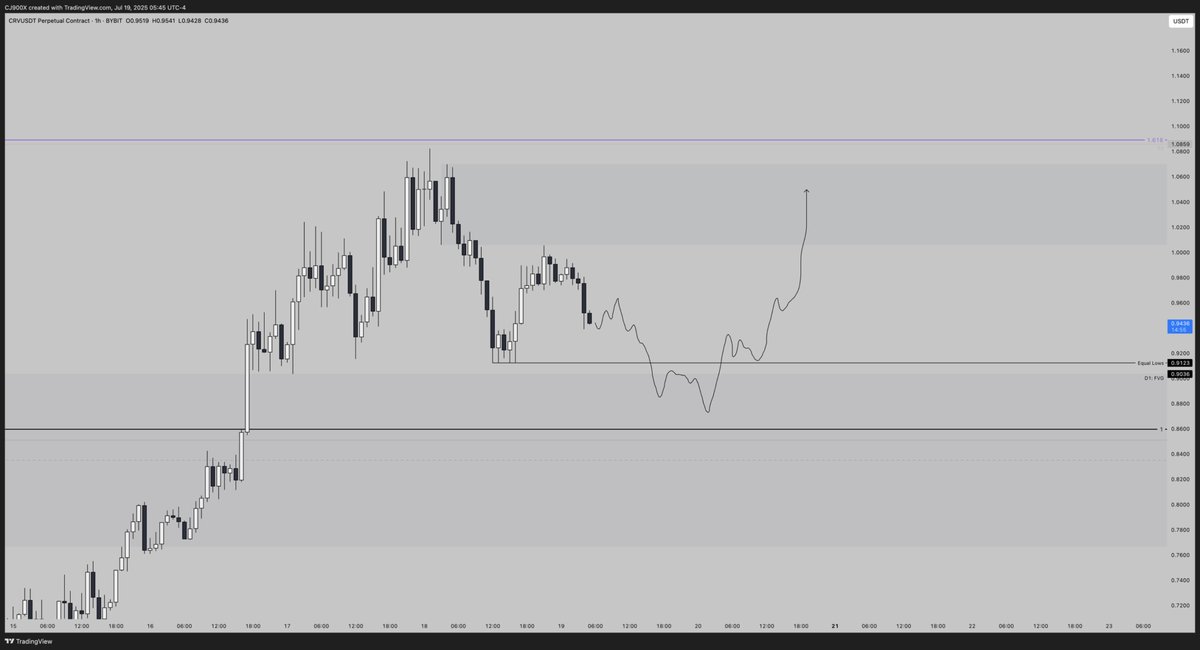
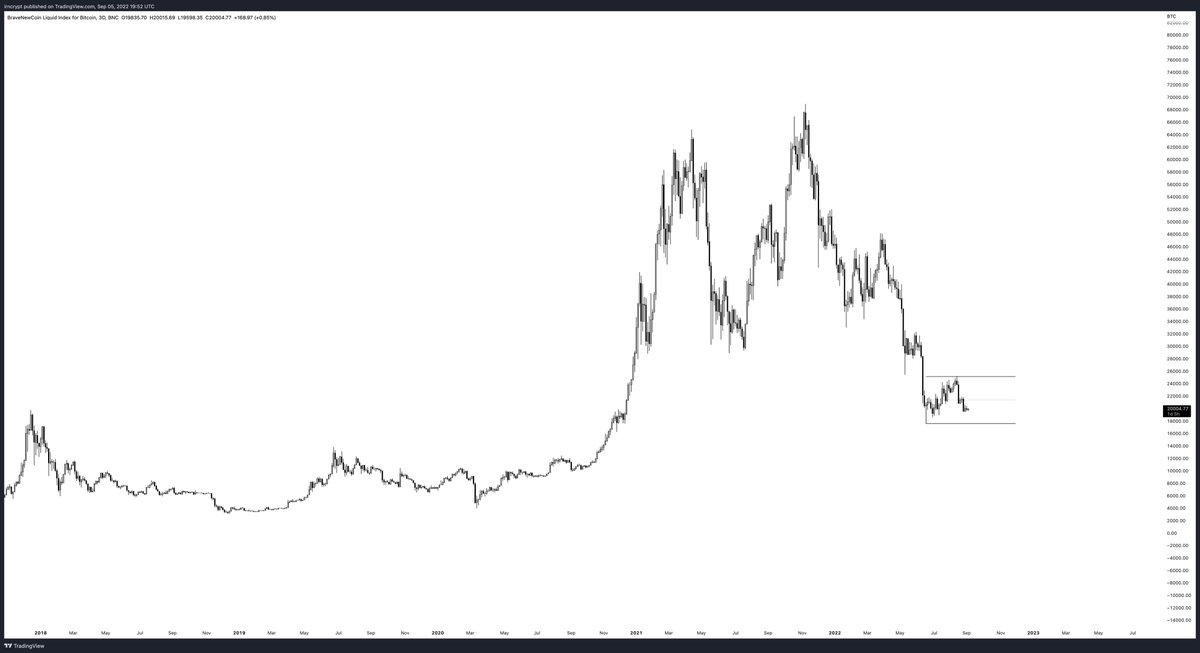
 Monthly - Range
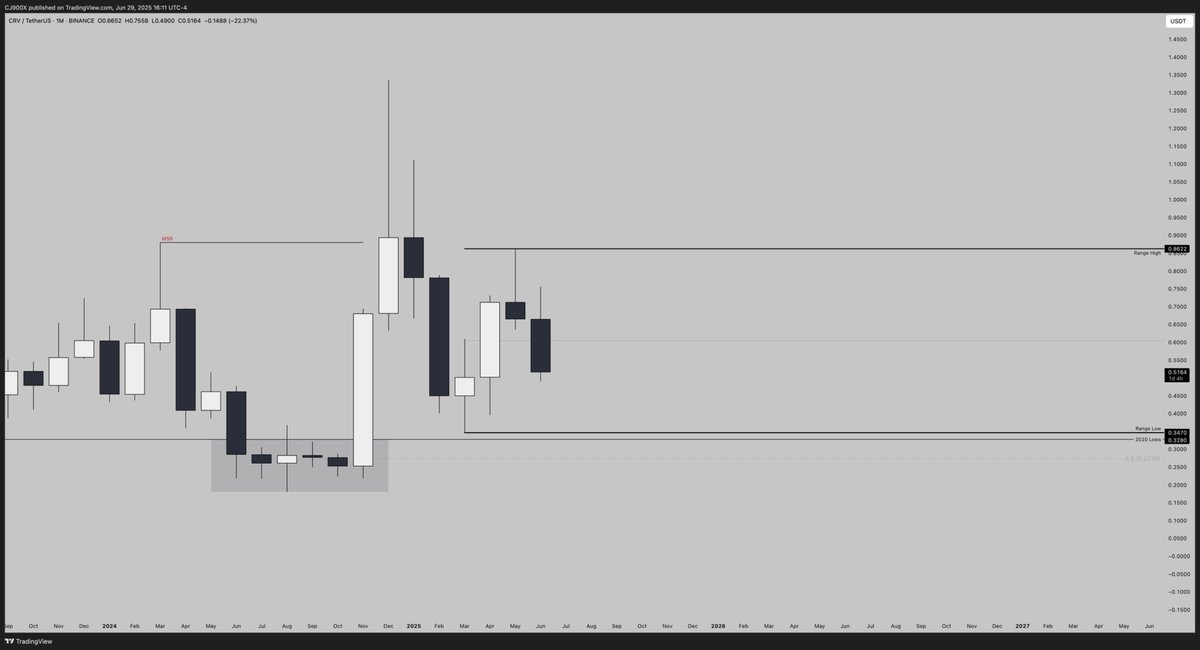
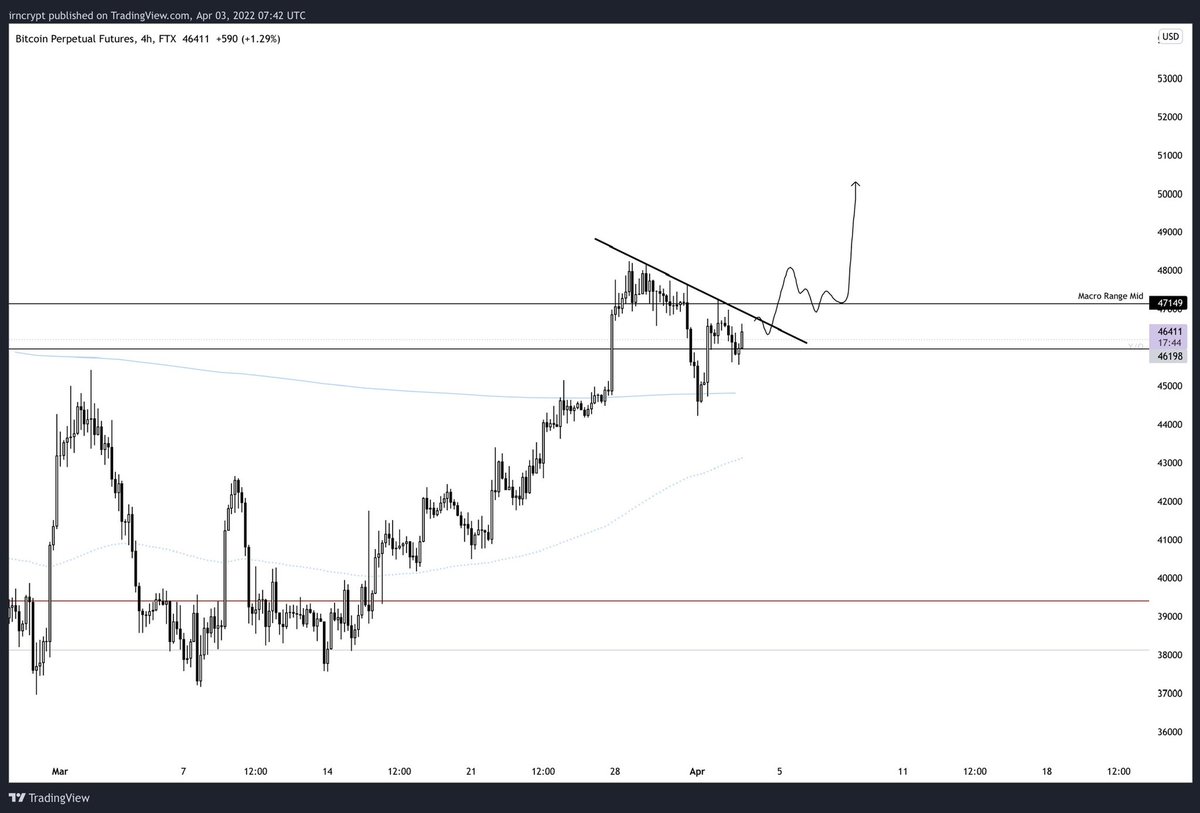
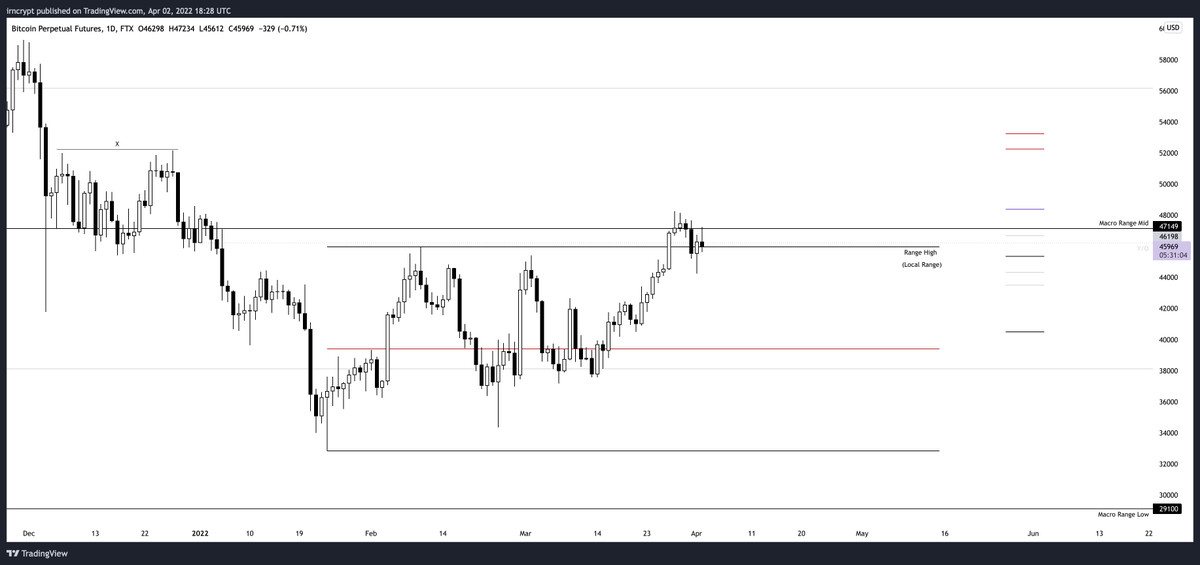
 $BTC - LTF
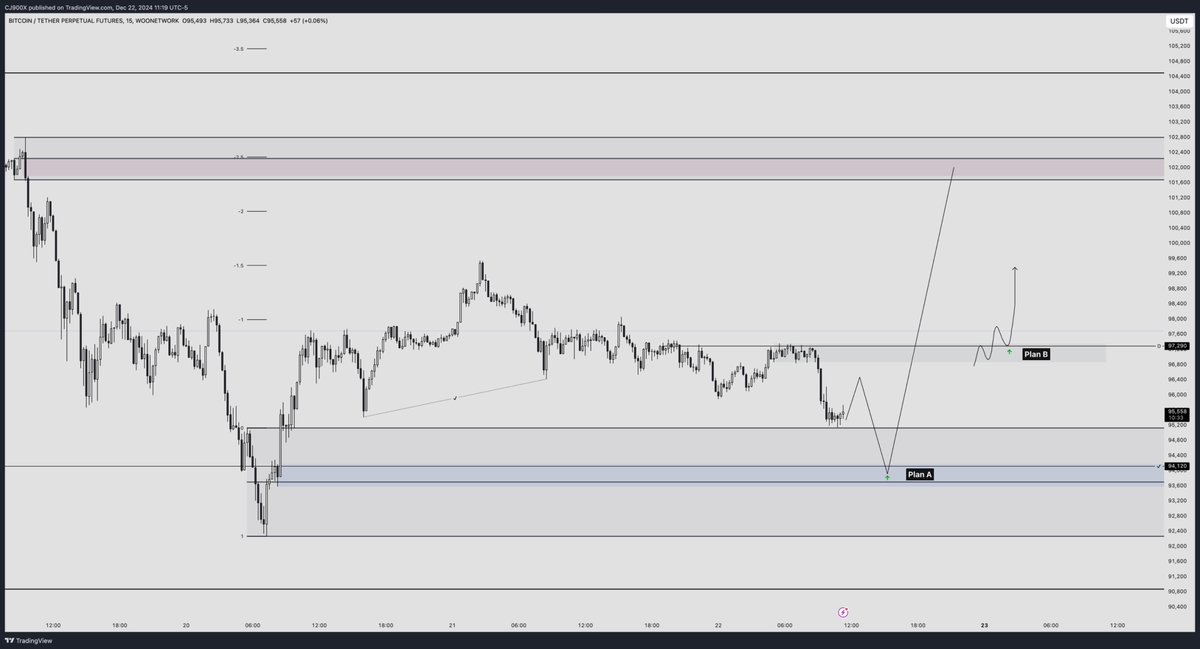
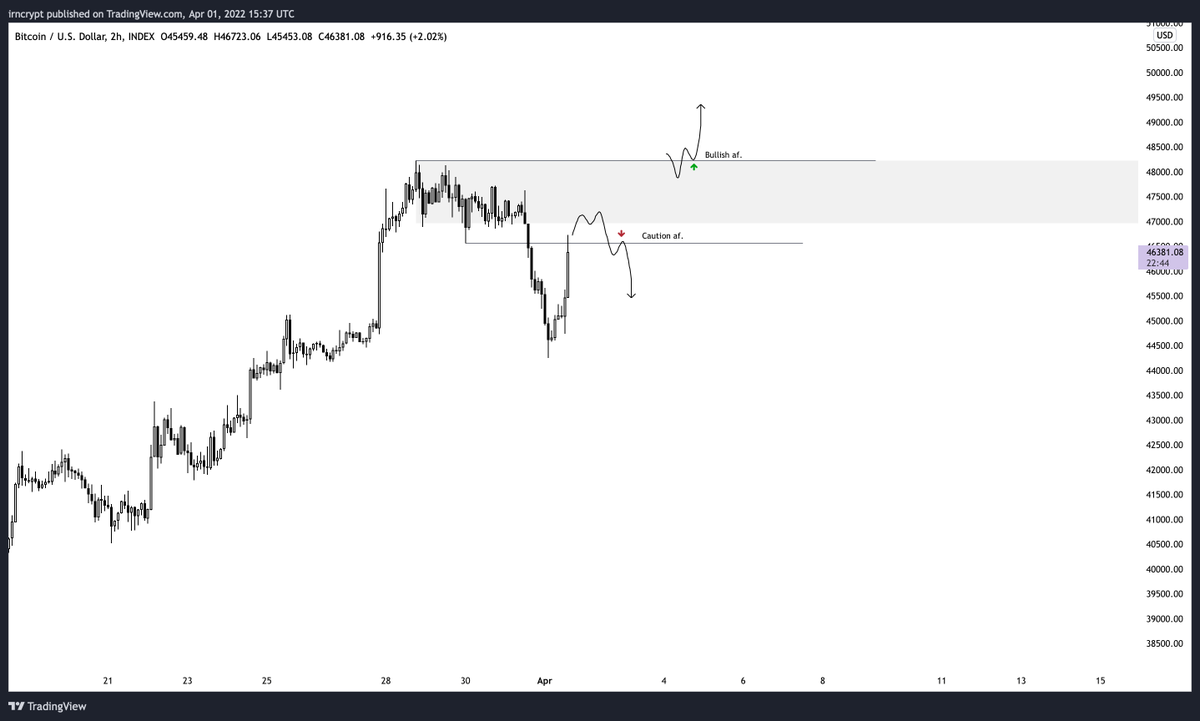
 Breakout Attempt #1
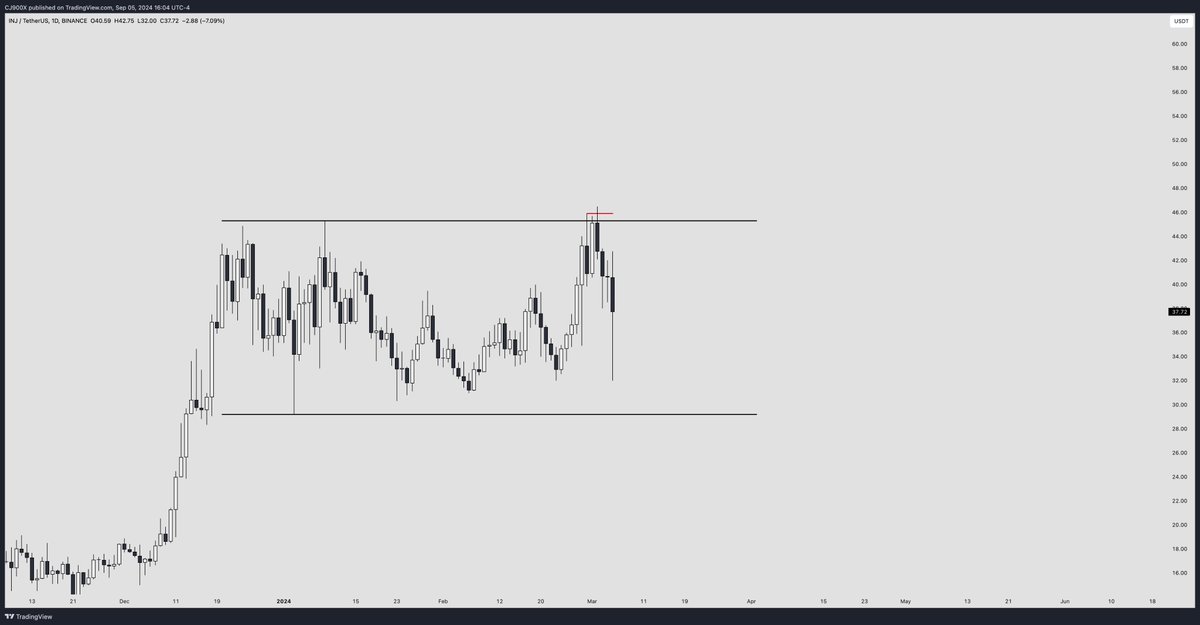
 Diagonal looks ripe for a squeeze tbh
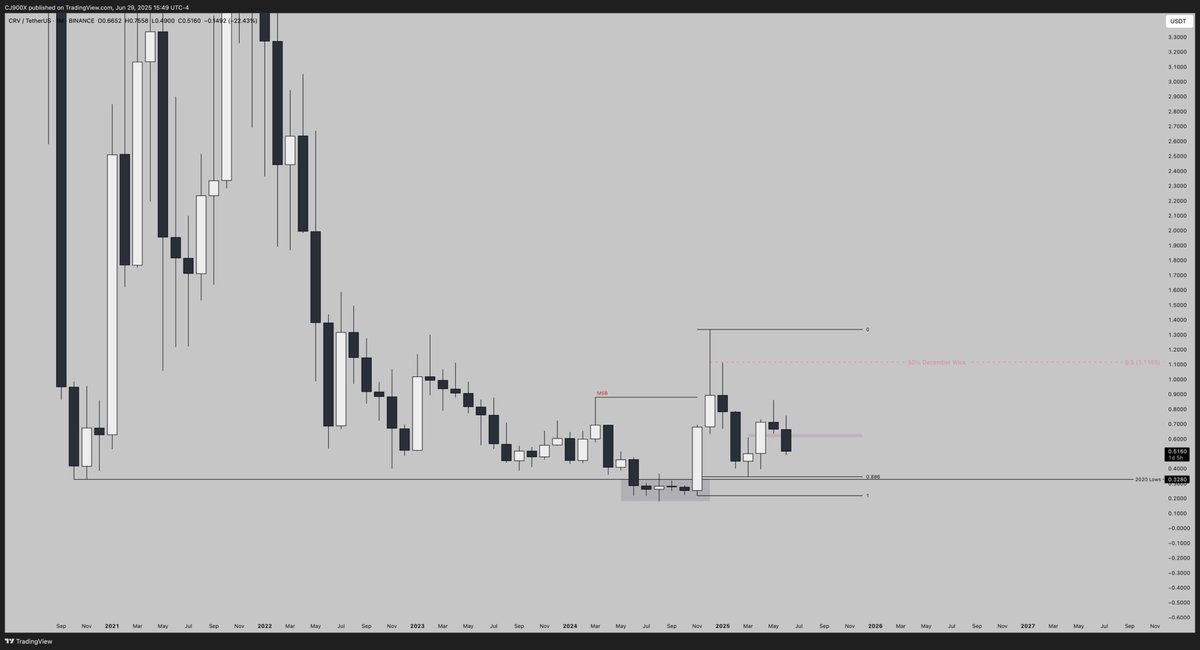
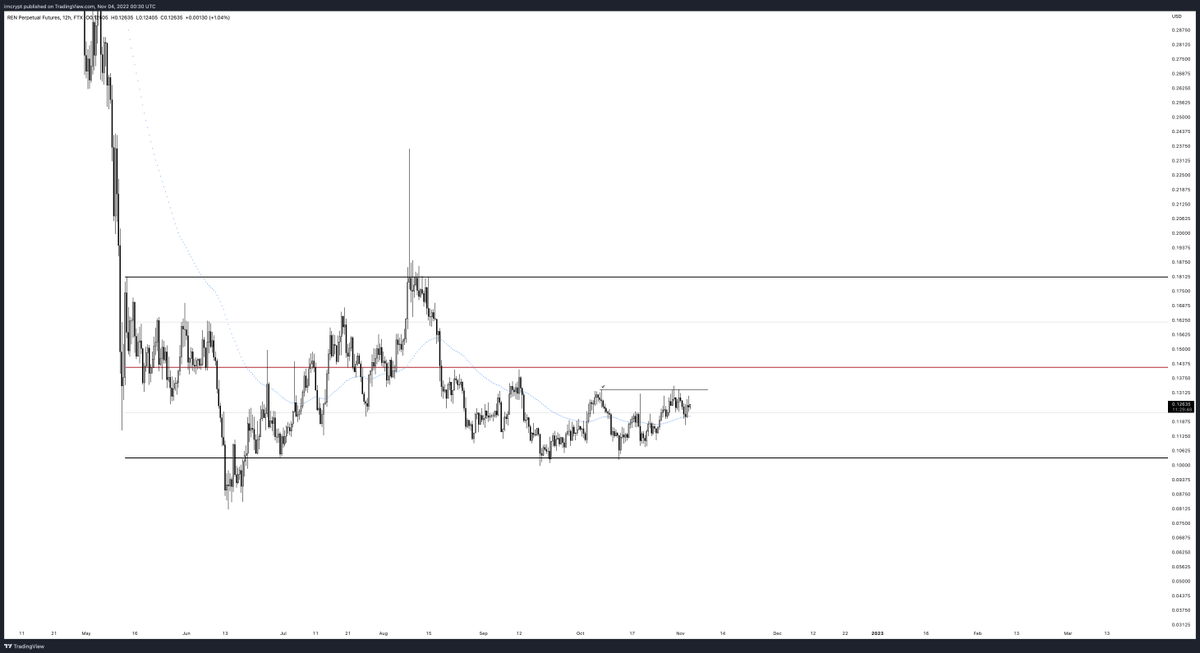 Invalidation < 0.117
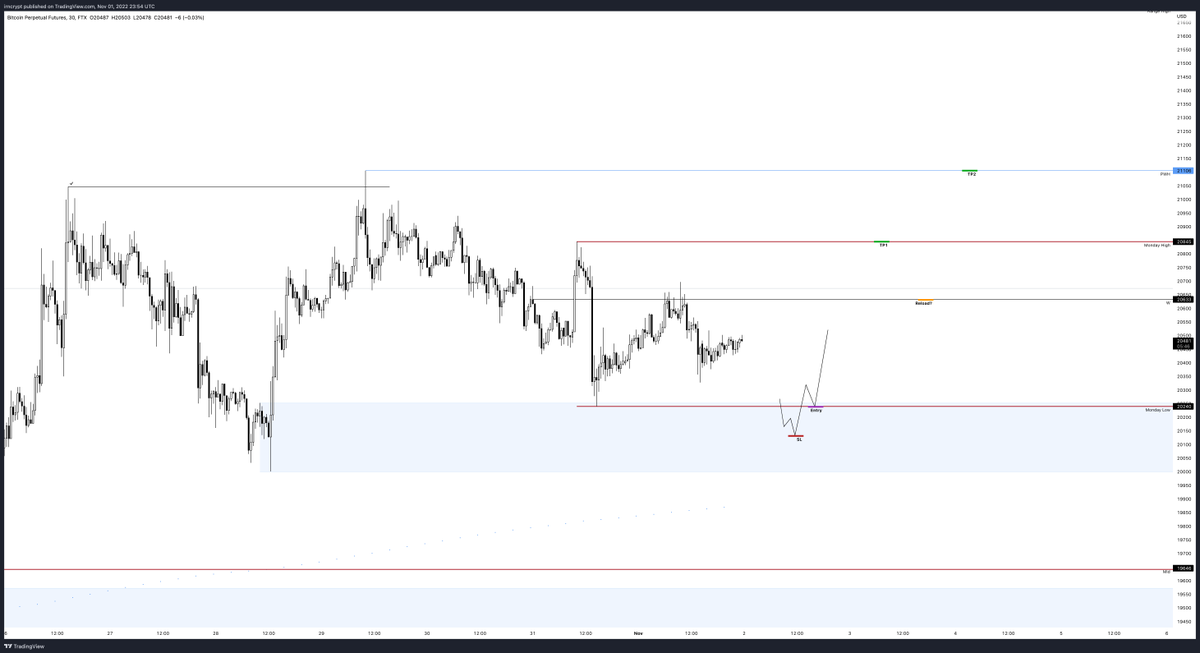 Hmm. Also v possible we run the highs first looking at these wicks.
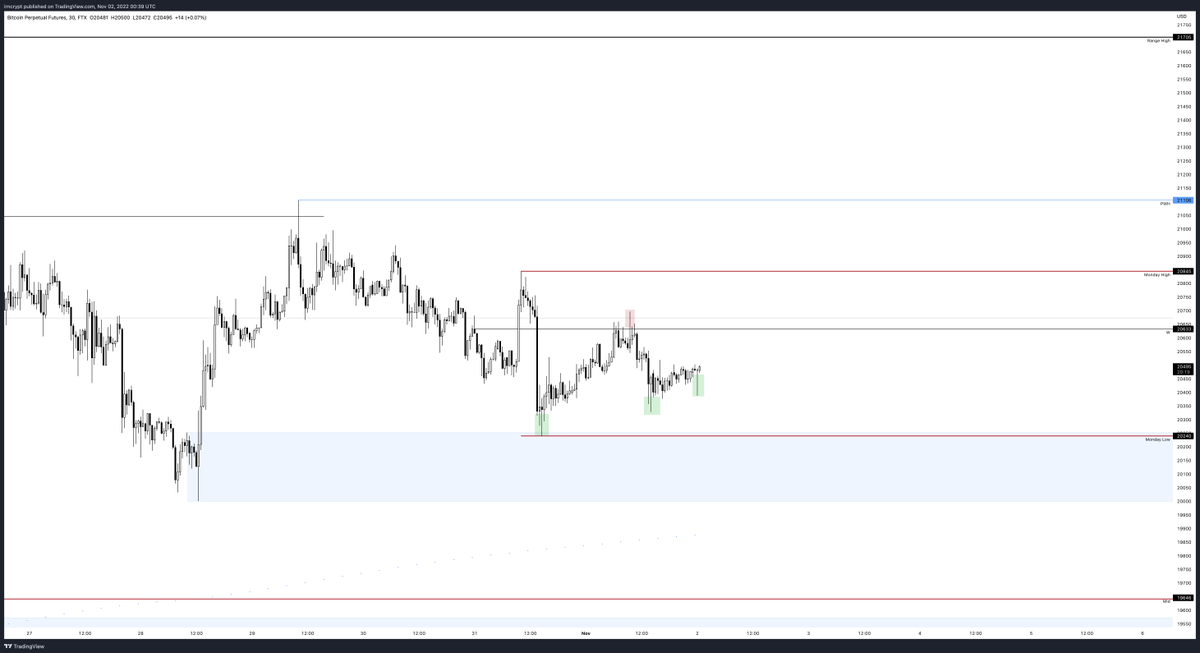
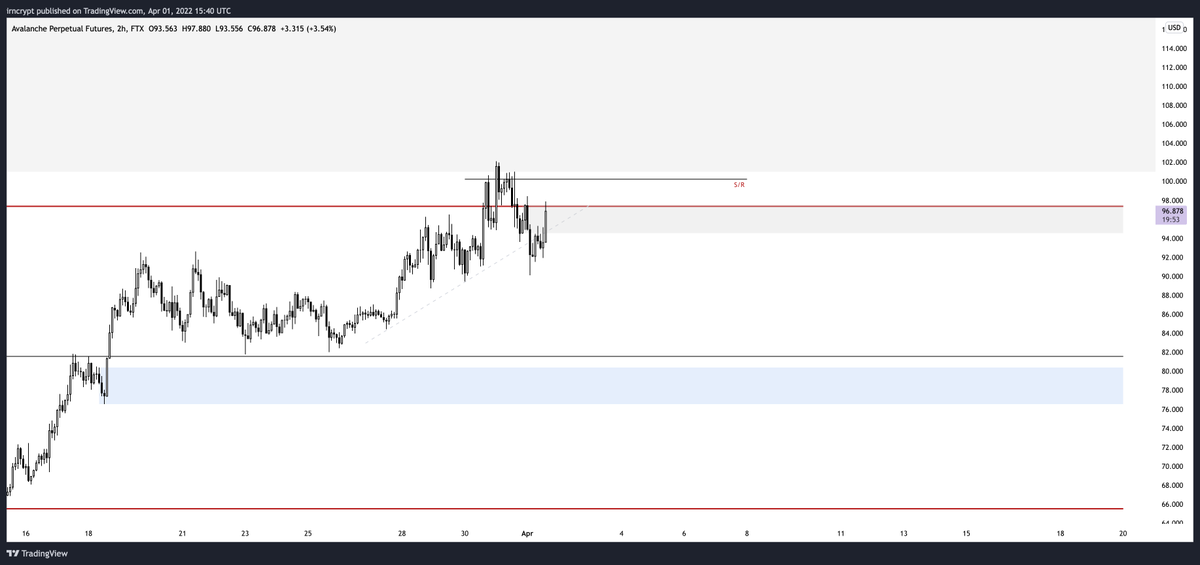
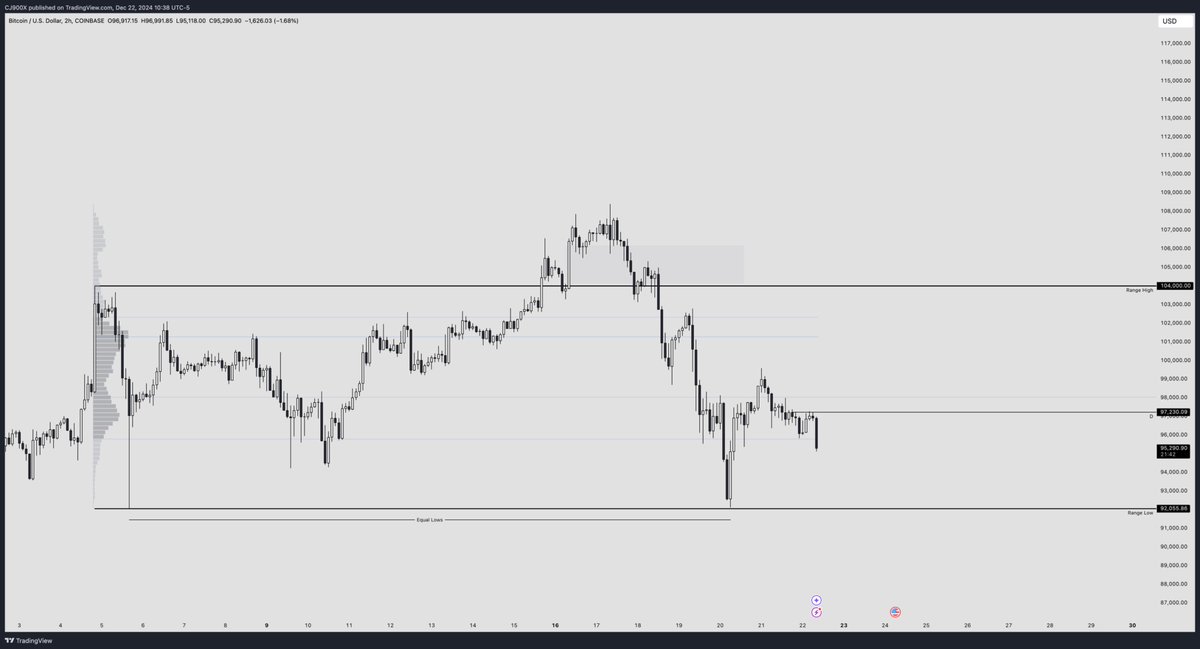
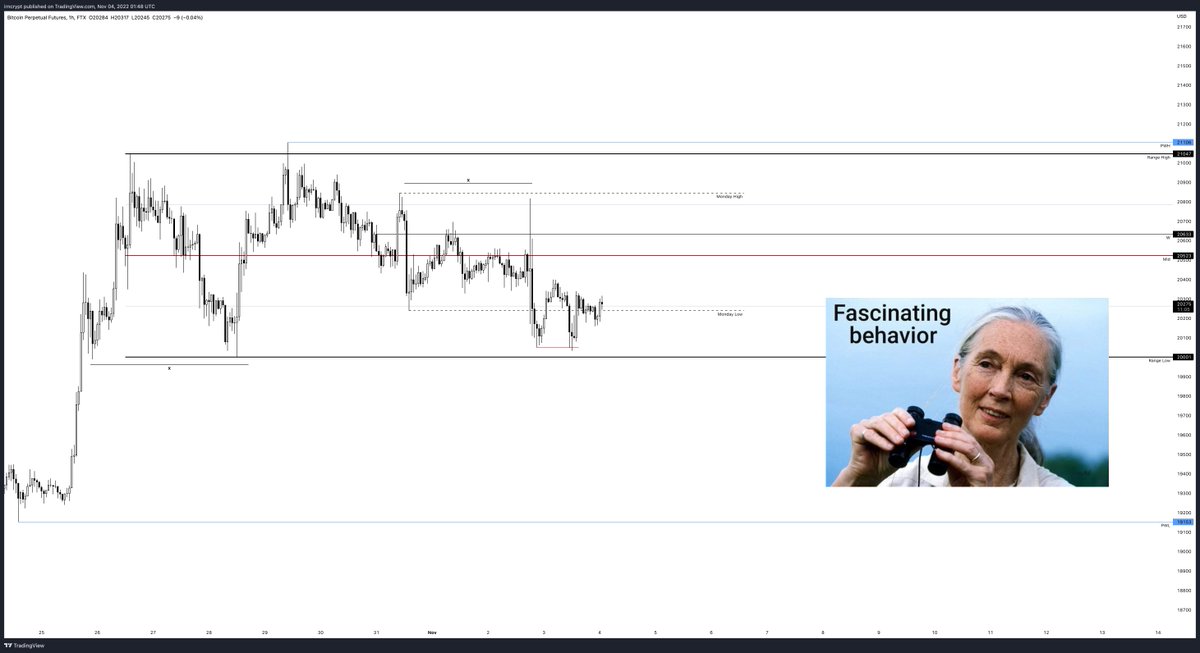
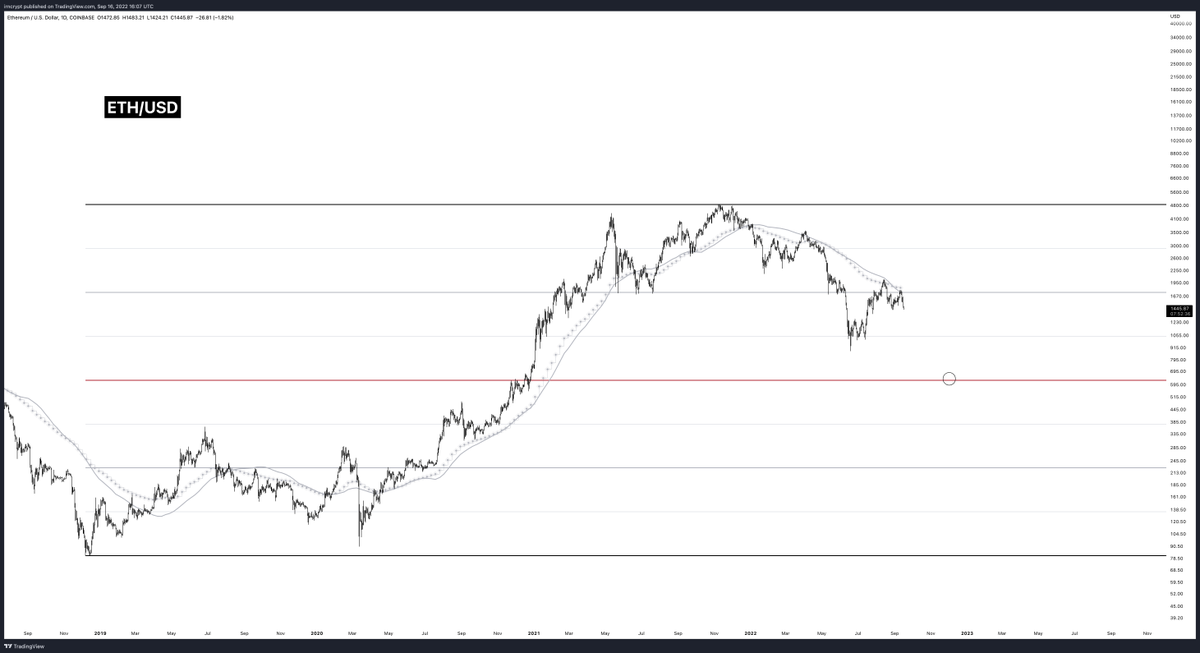 Reclaim the next S/R level and the weekly moving averages - then we're talking. Otherwise, you need to consider the possibility of lower prices.
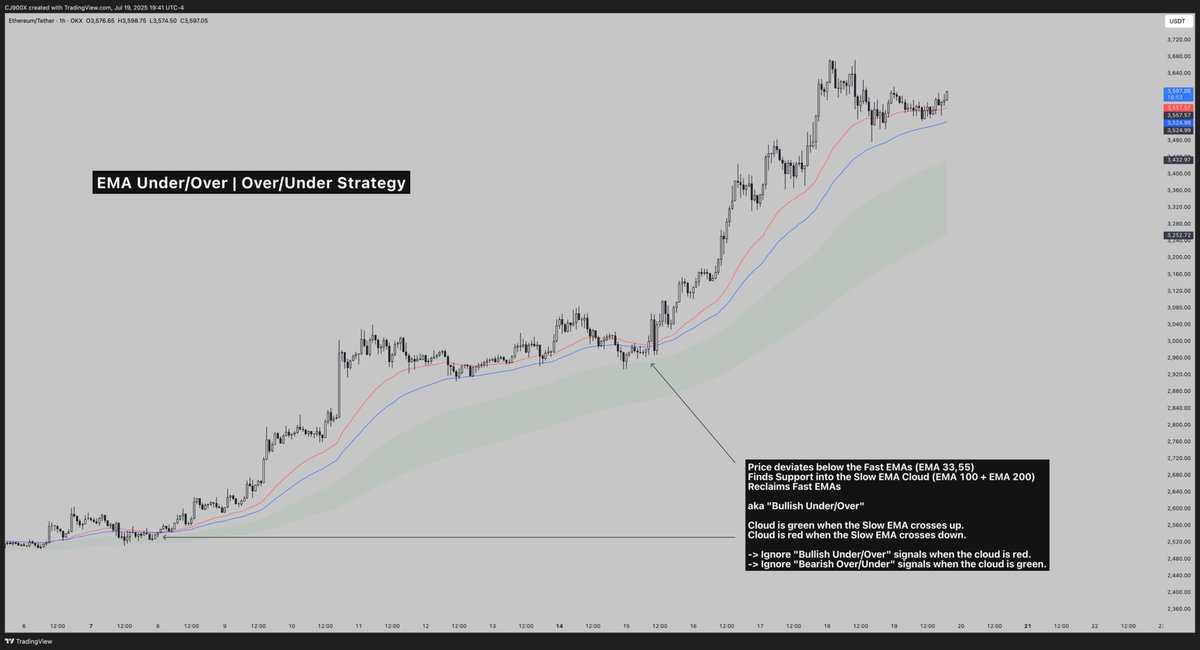
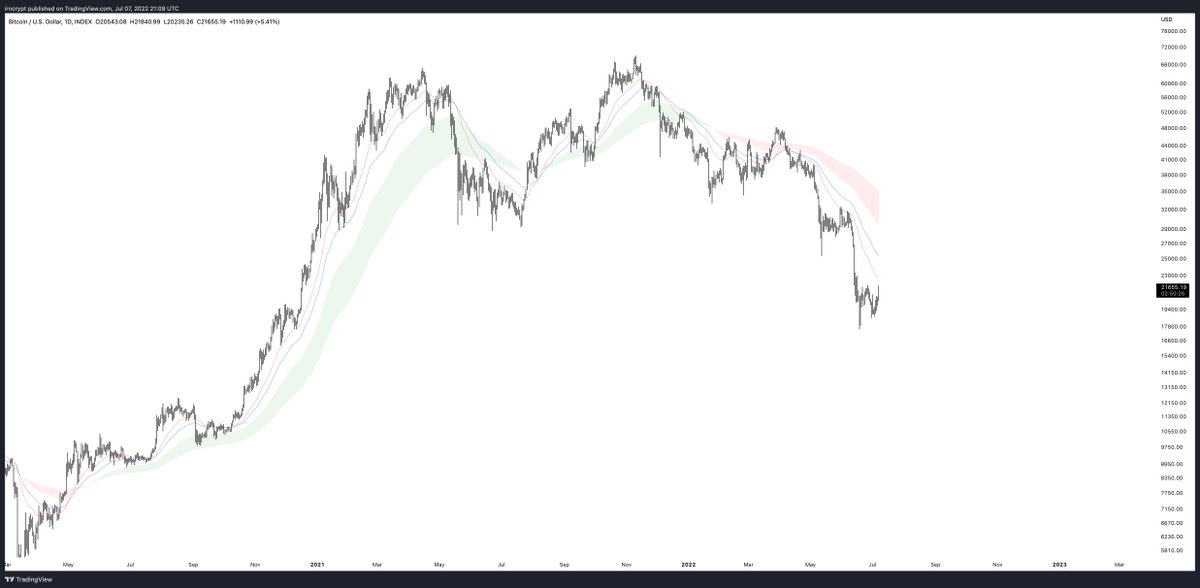 As it stands today, the EMA cloud is red and we haven't even touched the fastest moving average yet ...
 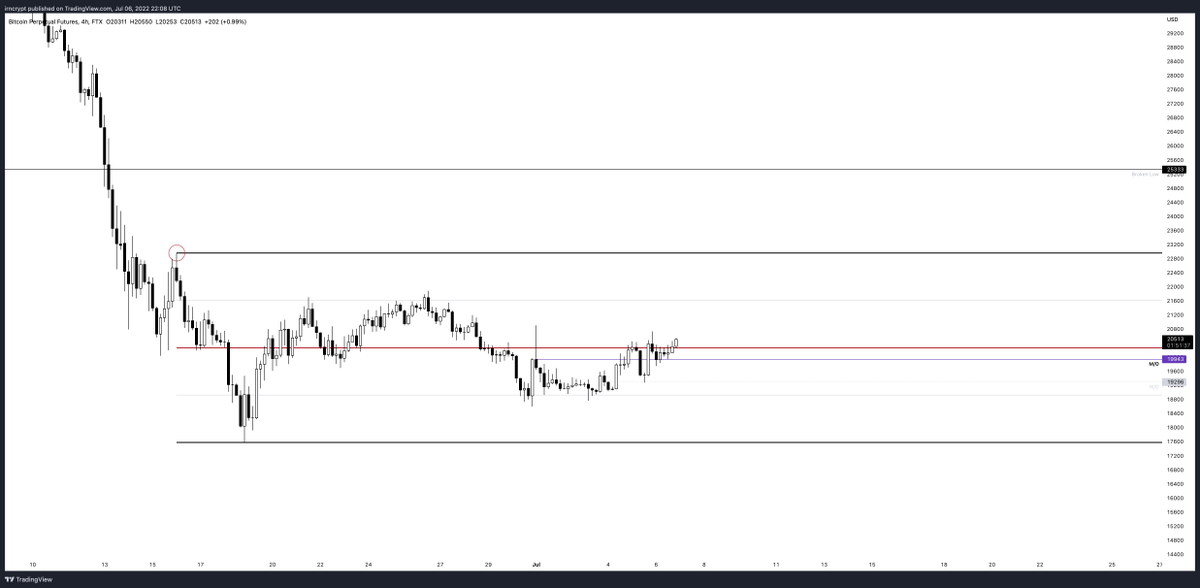 No position here. Haven't got a setup on the lower timeframe. While the levels are holding (Weekly, Monthly S/R Flip) this local consolidation on the lower timeframe looks a little shitty.
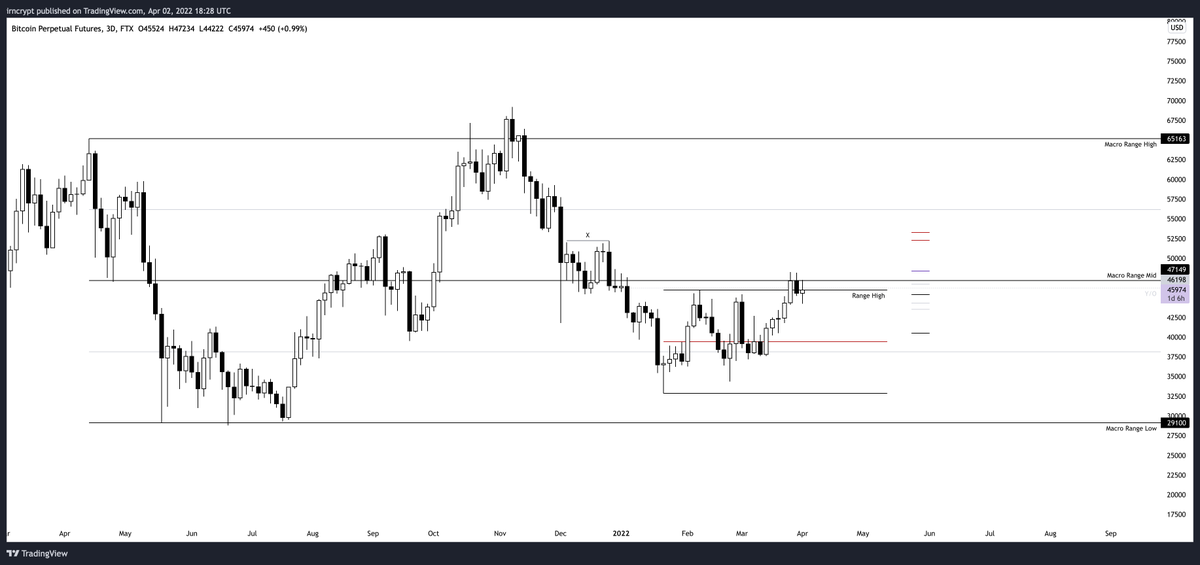
 This would be quite something