Dan O'Hara Profile picture
Aug 7, 2025 7 tweets 3 min read Read on X
The PCR positivity map is out.

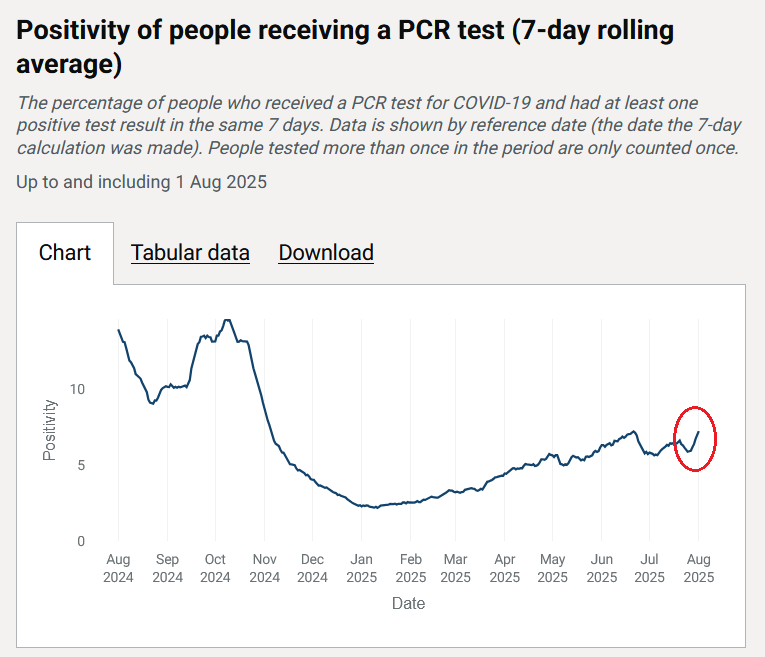
National positivity has rebounded very suddenly to the highest level it's been all year.

It looks like most areas are seeing the yoyo effect this week.


1/7 jamestindall.info/skeuomorpholog…Image
The upturn has been particularly sudden and sharp, from 5.9 to 7.26% over the last week.

We haven't seen sudden & rapid growth like this since the autumn wave last year.

12% of areas aren't reporting, so 7.26% is an underestimate.

2/7 Image
Cornwall, Devon, Somerset, Dorset, Bath are all climbing rapidly.

The outlier is Plymouth at 28.99%, on a reliable level of testing.

Further east along the south coast there's a lot of non-reporting, but Portsmouth & W Sussex are on 12/13%.

3/7 Image
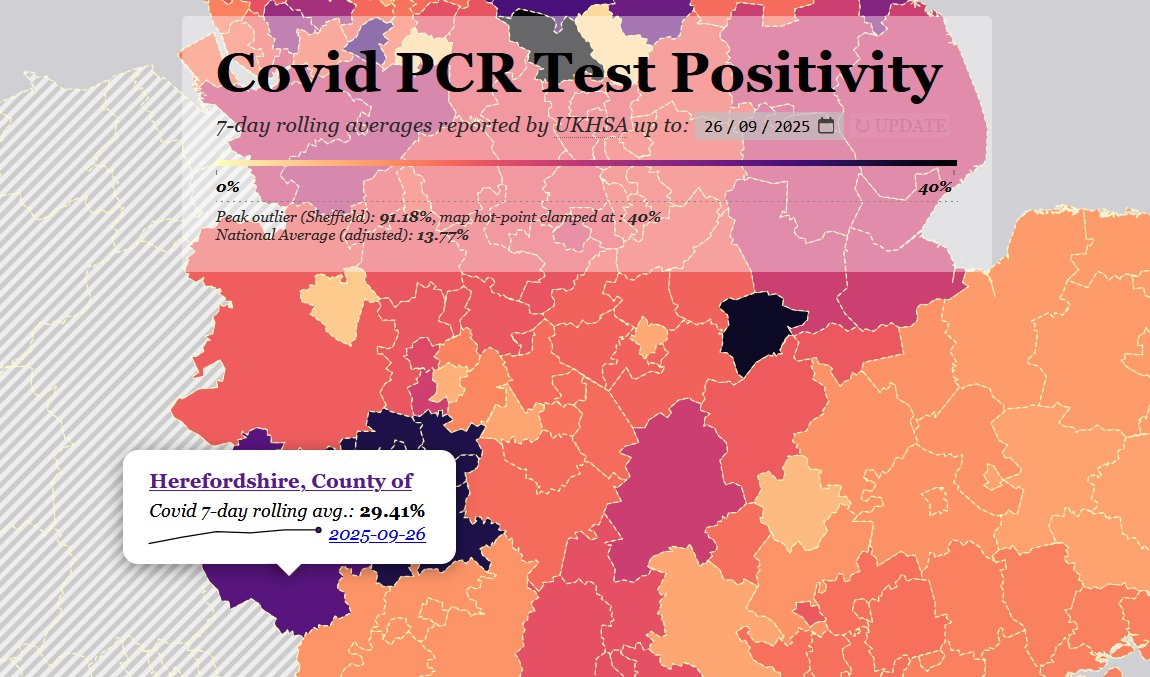
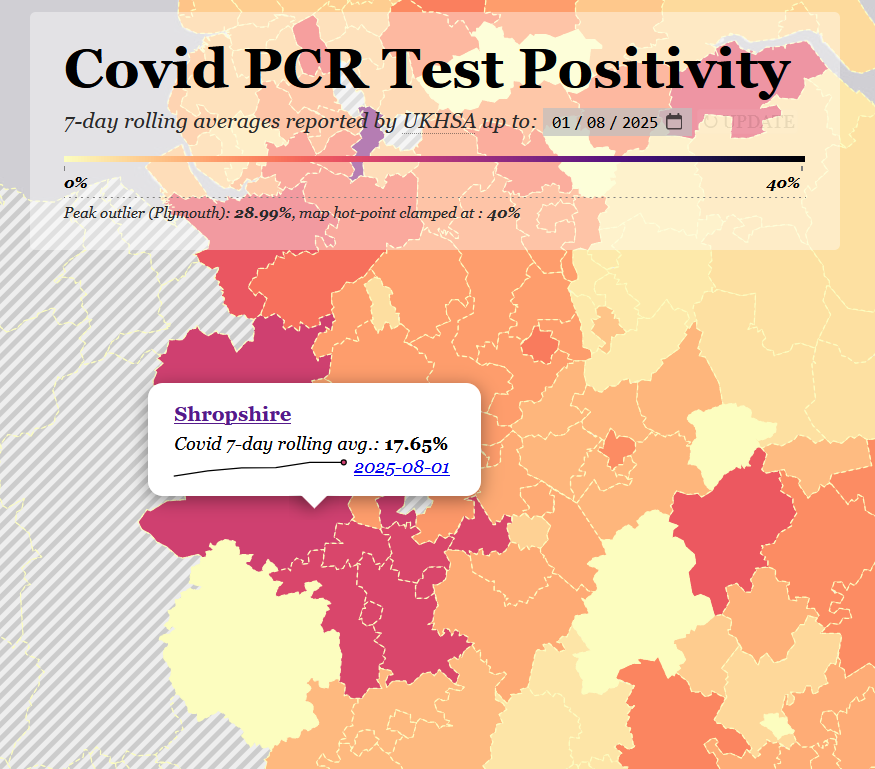
Shropshire also tests reliably, and has shot up to 17.65%.

You can see the rebound hitting Birmingham, Leicester, Derby... but not Coventry, which is possibly benefiting from its lack of touristic magnetism.

4/7 Image
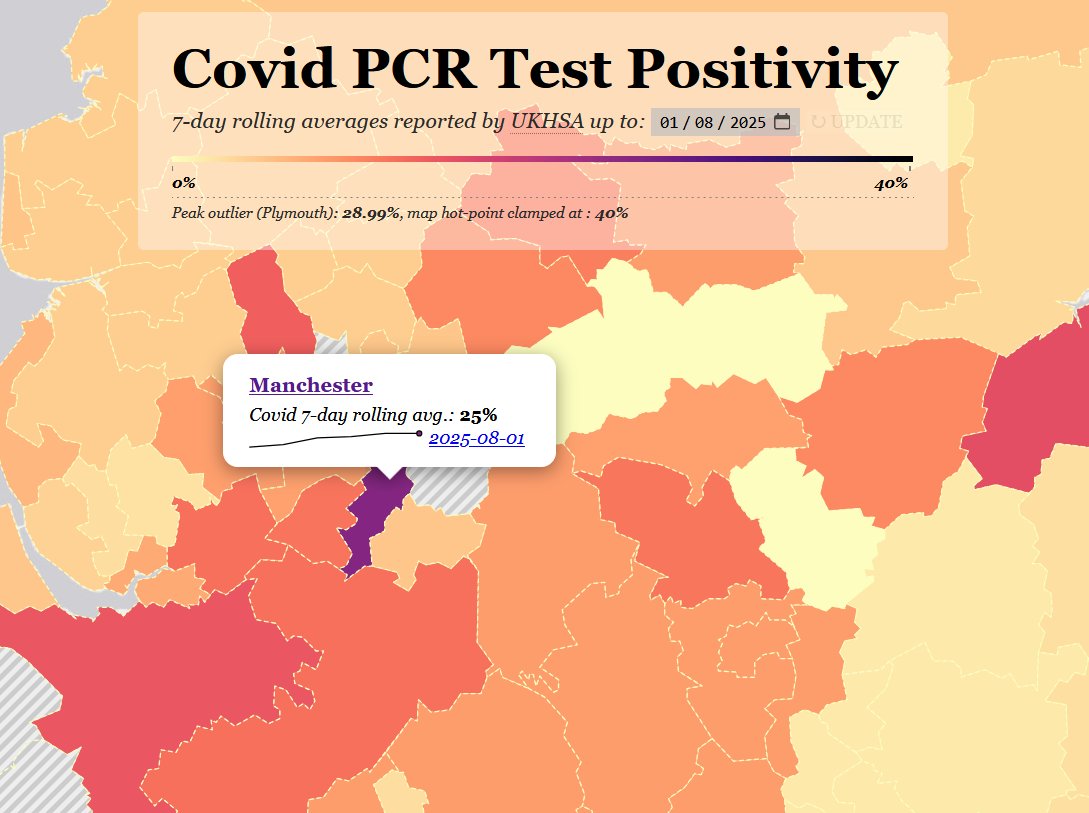
Manchester's the 2nd outlier on 25%, but on poor testing.

If high levels of natural immunity were actually a thing, @UKHSA, this part of the north should have superimmunity.

But Sheffield, Leeds, Bradford, Doncaster, Bolton are all bouncing up yet again.

5/7 Image
@UKHSA Not much reporting on Tyneside, but Teesside, Durham, Cumbria, which have just been having a large wave, are seeing yet another spike.

20% in Stockton-on-Tees is higher even than the autumn wave last year.

6/7 Image
@UKHSA There's a lot going on this week across the map.

Please do use it to check your area and, if you're not sure what you're seeing, do ask me!

We'll have to wait to see, but that sharp upswing doesn't look like just school holidays to me.

7/7 Image

• • •

Missing some Tweet in this thread? You can try to force a refresh
 

Keep Current with Dan O'Hara

Dan O'Hara Profile picture

Stay in touch and get notified when new unrolls are available from this author!

Read all threads

This Thread may be Removed Anytime!

PDF

Twitter may remove this content at anytime! Save it as PDF for later use!

Try unrolling a thread yourself!

how to unroll video
  1. Follow @ThreadReaderApp to mention us!

  2. From a Twitter thread mention us with a keyword "unroll"
@threadreaderapp unroll

Practice here first or read more on our help page!

More from @skeuomorphology

Nov 6, 2025
The PCR positivity map is out, and you might notice something a bit different this week.

From now onwards the map includes Scotland, using the same metric: PCR test positivity.


1/10 jamestindall.info/skeuomorpholog…Image
When you click on a Scottish local area, there is no trendline, as the data is delivered as a weekly total.

You can check the underlying data in the same way as England: by clicking on the name of the area in the pop-up bubble.

2/10 Image
You'll see we've also included the Scotland total average.

Unlike England, this is not adjusted for non-reporting - my experience with the Scottish data tells me it won't necessary.

The Scottish data is also more recent, running up to 4 days ago, i.e. last Sunday.

3/10 Image
Read 10 tweets
Oct 9, 2025
The PCR positivity map is out, and UKHSA have finally deigned to describe covid activity as "medium".

UKHSA national positivity is 13.23%.

Adjusted for non-reporting we make it 15.27%.


1/ jamestindall.info/skeuomorpholog…Image
Hospital stats have been updated to the end of September - so, ten days ago.

As with positivity, there are many hospitals that aren't reporting.

One indicative figure is hospital staff off sick with covid: 3-400 most of the year, but climbed to nearly 700 over September.

2/8 Image
In what follows, I'm using the hospital stats as well as the map.

Where's getting hit the hardest?

In the south, Devon has seen a rebound, with patients tripling over the last 2 weeks of September. Other areas are steadier.

3/8 Image
Read 9 tweets
Oct 2, 2025
The PCR positivity map is out, and it's evident that everywhere is seeing a significant surge.

UKHSA positivity has risen to 11.83%.

Adjusted for non-reporting areas, we make that 13.77%.


1/8 jamestindall.info/skeuomorpholog…Image
Most areas that weren't reporting in the south have started again, except Kent and E Sussex.

Even Southampton (who issued an avoid A&E notice on Tuesday) have reported.

In fact, this week they've reported all their data going back to March - it confirms what I suspected.

2/8 Image
We're starting to see areas in the Midlands increase the amount of testing they're doing again.

Herefordshire, Worcestershire (and Rutland on few but not meaninglessly few tests) look the worst hit; Dudley and Northampton not far behind.

3/8 Image
Read 8 tweets
Sep 18, 2025
The PCR positivity map is out, and you'll see we've added a new feature this week.

A National Average (adjusted) is displayed at the top of the map, below the banner.

What is it?

1/14 Image
This national average is our attempt to compensate for the number of areas that are not reporting.

UKHSA's published average is calculated counting all the 0% areas as genuine 0s, which means their national average is skewed downwards.

2/14 Image
We've moved over the last 12 months from every area reporting to around 20% failing to report (though it does vary each week).

At the height of the October wave last year, shown here, every area was reporting & the national stat was reliable.

Now it's not.

3/14 Image
Read 14 tweets
Sep 8, 2025
I know I don't often post except for Thursday's map updates, but there's something I need to discuss with you about the national PCR positivity rate.

That's the rate shown here.

🧵👇 Image
At the height of the October wave last year, every single area in England bar one was reporting test results regularly.

The map had no shaded areas. Image
Things have changed greatly since then.

In late January, a number of trusts decided to cut their testing dramatically.

In February, some trusts stopped reporting results completely.
Read 18 tweets
Sep 4, 2025
The PCR positivity map is out, and while things may have calmed a little in Cumbria, and in Devon, everywhere else looks to be rising.


1/7 jamestindall.info/skeuomorpholog…Image
National positivity started climbing again 10 days ago and was 9.25% as of last Friday.

Unfortunately that rise was before schools went back, so we're yet to see the usual start-of-term boost.

2/7 Image
We now have data for the areas on Teesside and Tyneside that were missing last week, and it looks grim.

Hartlepool's the outlier; everywhere else on ~20%, Durham already above that at 23.4%, N Yorkshire racing to join in.

All of them still rising.

3/7 Image
Read 7 tweets

Did Thread Reader help you today?

Support us! We are indie developers!


This site is made by just two indie developers on a laptop doing marketing, support and development! Read more about the story.

Become a Premium Member ($3/month or $30/year) and get exclusive features!

Become Premium

Don't want to be a Premium member but still want to support us?

Make a small donation by buying us coffee ($5) or help with server cost ($10)

Donate via Paypal

Or Donate anonymously using crypto!

Ethereum

0xfe58350B80634f60Fa6Dc149a72b4DFbc17D341E copy

Bitcoin

3ATGMxNzCUFzxpMCHL5sWSt4DVtS8UqXpi copy

Thank you for your support!

Follow Us!

:(