
PMC COVID Dashboard, August 11, 2025 (U.S.)
The CDC says transmission is heating up.
"Very High" (3)
🔺Guam
🔺Hawai'i
🔺Louisiana
"High" (12)
🔺Alabama
🔺Alaska
🔺California
🔺Colorado
🔺Delaware
🔺Florida
🔺Indiana
🔺Mississippi
🔺Nevada
🔺S. Carolina
🔺Texas
🔺Utah
🧵1/12
The CDC says transmission is heating up.
"Very High" (3)
🔺Guam
🔺Hawai'i
🔺Louisiana
"High" (12)
🔺Alabama
🔺Alaska
🔺California
🔺Colorado
🔺Delaware
🔺Florida
🔺Indiana
🔺Mississippi
🔺Nevada
🔺S. Carolina
🔺Texas
🔺Utah
🧵1/12

Transmission is highest in these regions. Graphics note the CDC levels and PMC prevalence estimates.
🔥Louisiana (Very High): 1 in 19 actively infectious
🔥Guam (Very High): 1 in 26
🔥Hawai'i (Very High): 1 in 28
🔥Texas (High): 1 in 45
🧵2/12
🔥Louisiana (Very High): 1 in 19 actively infectious
🔥Guam (Very High): 1 in 26
🔥Hawai'i (Very High): 1 in 28
🔥Texas (High): 1 in 45
🧵2/12

Statewide transmission remains "High" in Florida, according to the CDC. PMC estimates 1 in 50 actively infectious.
Several cities report "Very High" transmission. Several sites are offline.
🧵3/12
Several cities report "Very High" transmission. Several sites are offline.
🧵3/12

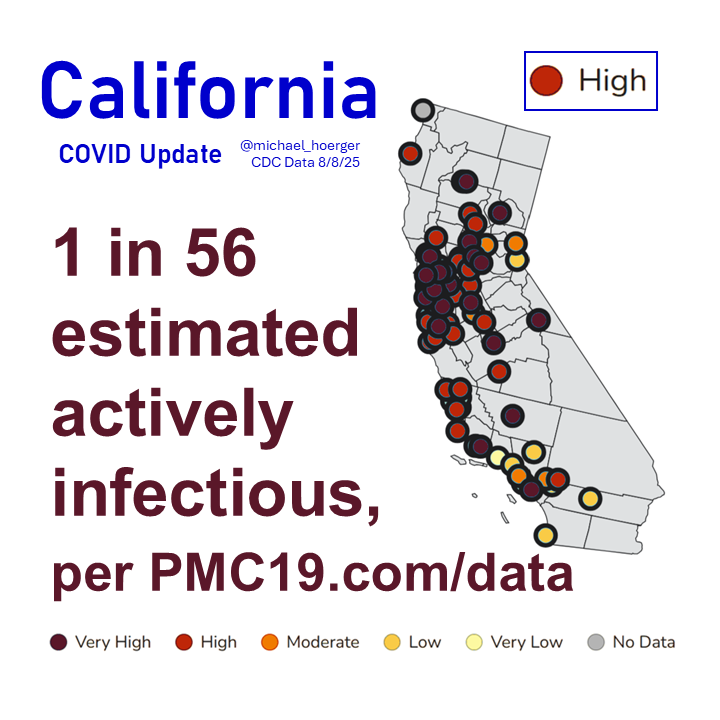
Statewide transmission remains "High" in California, according to the CDC, but notice that transmission is "Very High" in many cities.
PMC estimates 1 in 56 are actively infectious statewide, and at least 1 in 40 in the dark red zones.
🧵4/12
PMC estimates 1 in 56 are actively infectious statewide, and at least 1 in 40 in the dark red zones.
🧵4/12
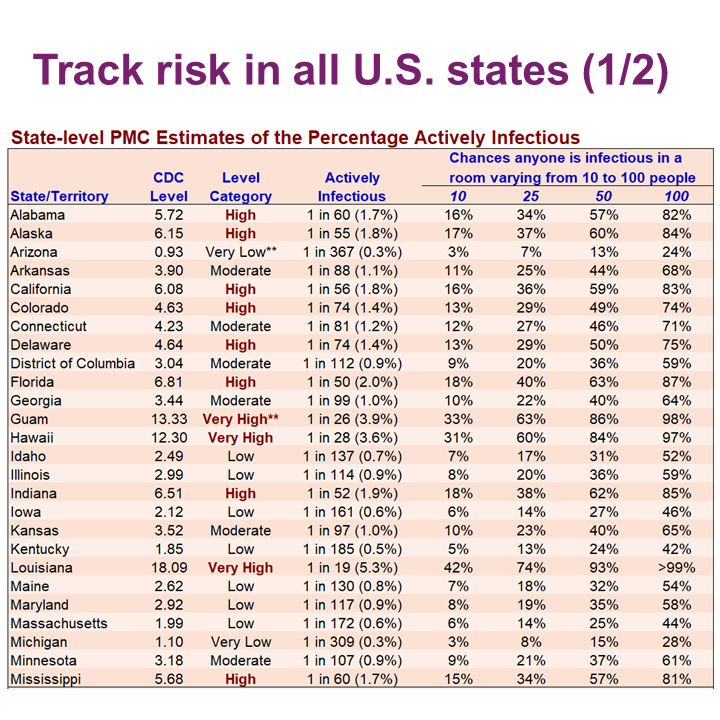
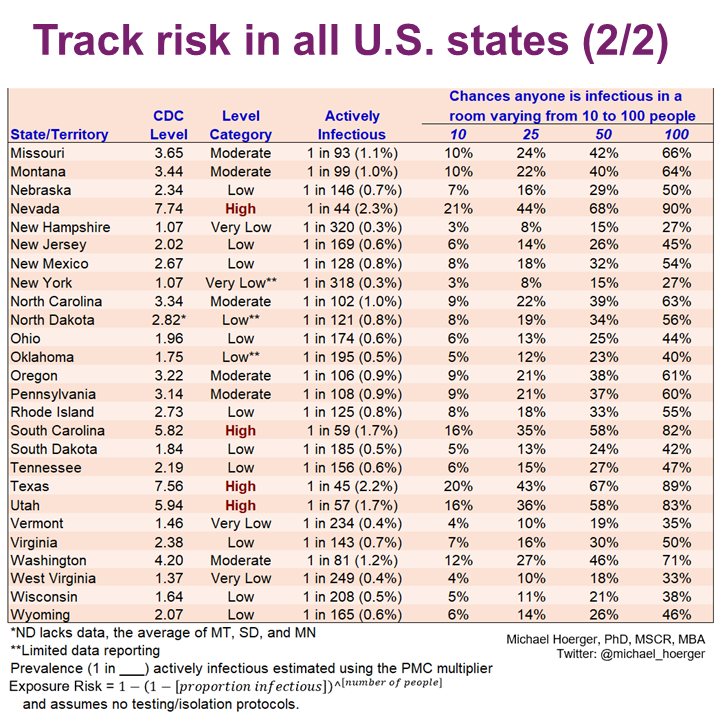
New Today:
For each state, the PMC dashboard now lists CDC levels, prevalence estimates, and chances of an exposure based on gathering size.
This chart continues in the next post.
🧵5/12 pmc19.com/data
For each state, the PMC dashboard now lists CDC levels, prevalence estimates, and chances of an exposure based on gathering size.
This chart continues in the next post.
🧵5/12 pmc19.com/data
In addition to our new state-level table (continued here), you can always scroll down further on the dashboard to find links to more CDC and non-CDC data in your area (if available).
Direct link to those sources:
🧵6/12 pmc19.com/data/index.php…
Direct link to those sources:
🧵6/12 pmc19.com/data/index.php…
Our forecast continues to show levels likely rising.
There are many sites offline and huge data lags, so these real-time estimates are imperfect. Notice the low versus high estimates in the forecast.
Much uncertainty. Track locally as best you can.
🧵7/12
There are many sites offline and huge data lags, so these real-time estimates are imperfect. Notice the low versus high estimates in the forecast.
Much uncertainty. Track locally as best you can.
🧵7/12
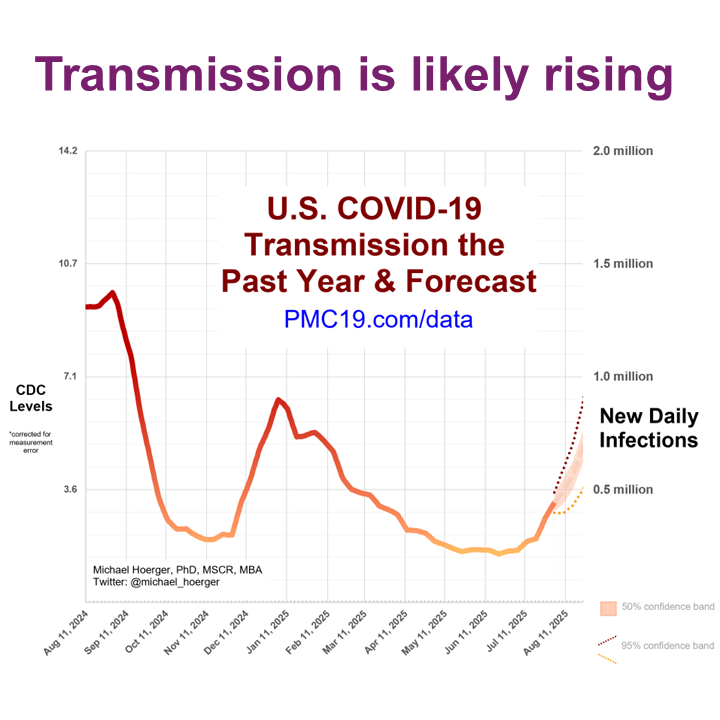
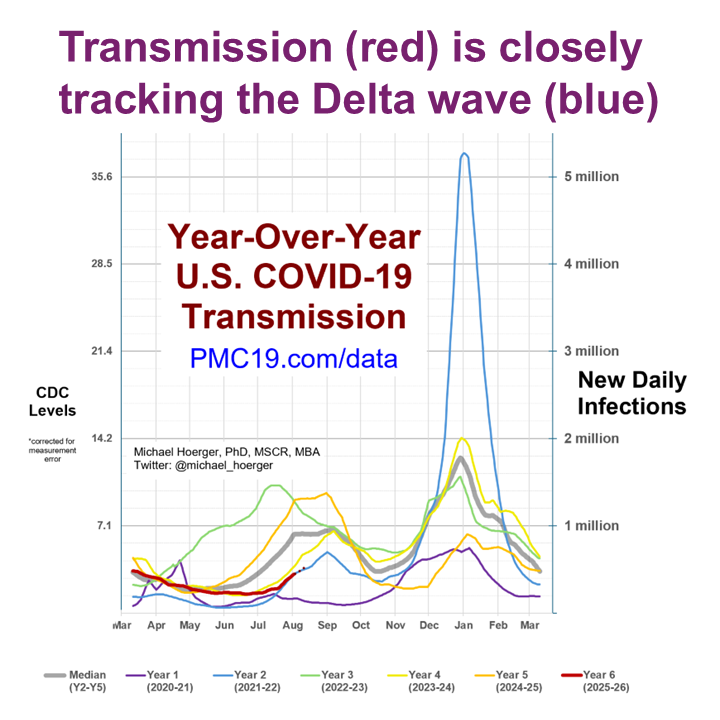
Notice that current transmission (red) is closely tracking that of the Delta wave (blue, 4 years ago).
I cannot imagine transmission peaking much lower than that. With uncertainty (NY mostly offline), the peak could be marginally higher or wider.
🧵8/12
I cannot imagine transmission peaking much lower than that. With uncertainty (NY mostly offline), the peak could be marginally higher or wider.
🧵8/12
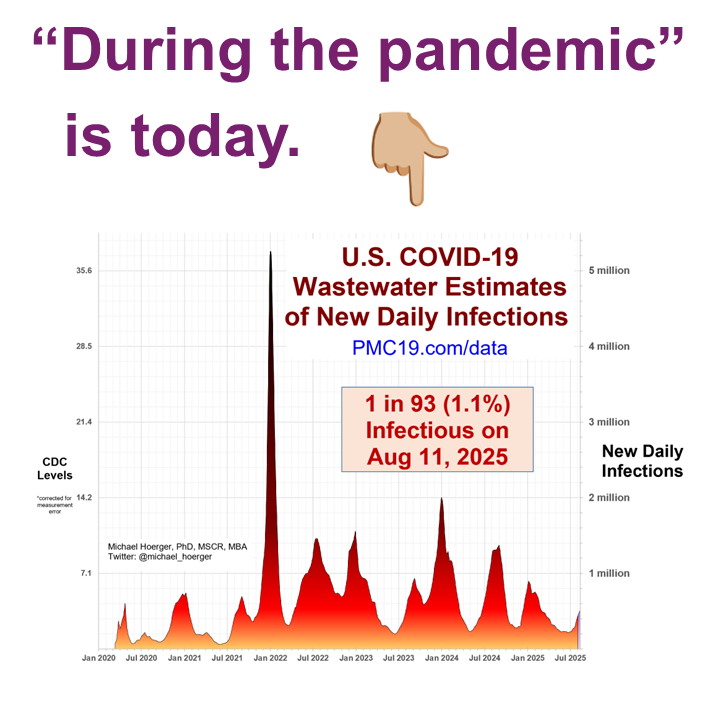
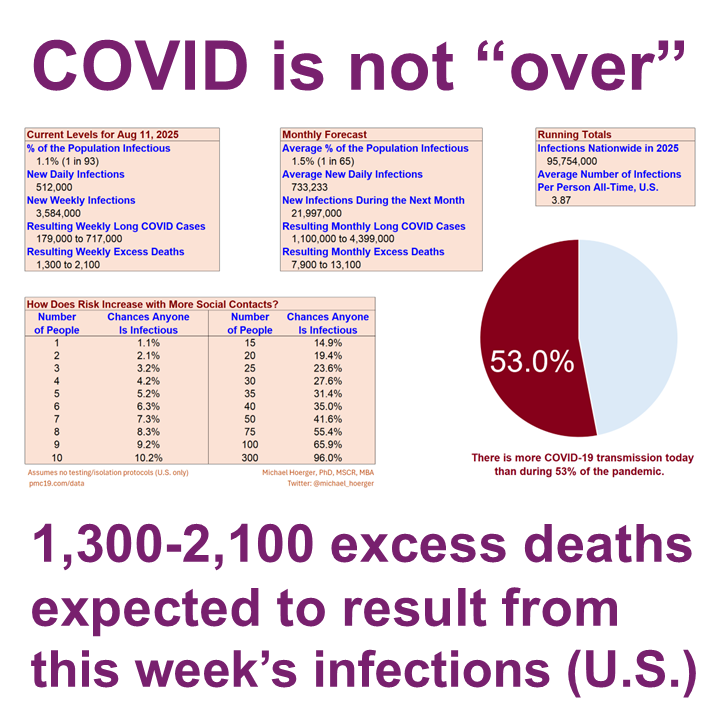
We remain in a pandemic. An estimated 1 in 93 are actively infectious today.
Expect the real-time estimates to bounce up or down a bit with the sites offline and lags in reporting. Biobot (20% model weight) took the week off entirely.
🧵9/12
Expect the real-time estimates to bounce up or down a bit with the sites offline and lags in reporting. Biobot (20% model weight) took the week off entirely.
🧵9/12
Today in the U.S.
🔥More transmission than 53% of days from pandemic onset to present
🔥3.6 million weekly infections
🔥Actuarial-derived estimates suggest this week's infections will cause 1,300-2,100 excess deaths
🧵10/12
🔥More transmission than 53% of days from pandemic onset to present
🔥3.6 million weekly infections
🔥Actuarial-derived estimates suggest this week's infections will cause 1,300-2,100 excess deaths
🧵10/12
Register and join us Sunday for the "Back-to-School Health Forum."
Could you comment here with any questions you'd like me to answer on Sunday?
🧵11/12 bit.ly/MTAHealthForum
Could you comment here with any questions you'd like me to answer on Sunday?
🧵11/12 bit.ly/MTAHealthForum

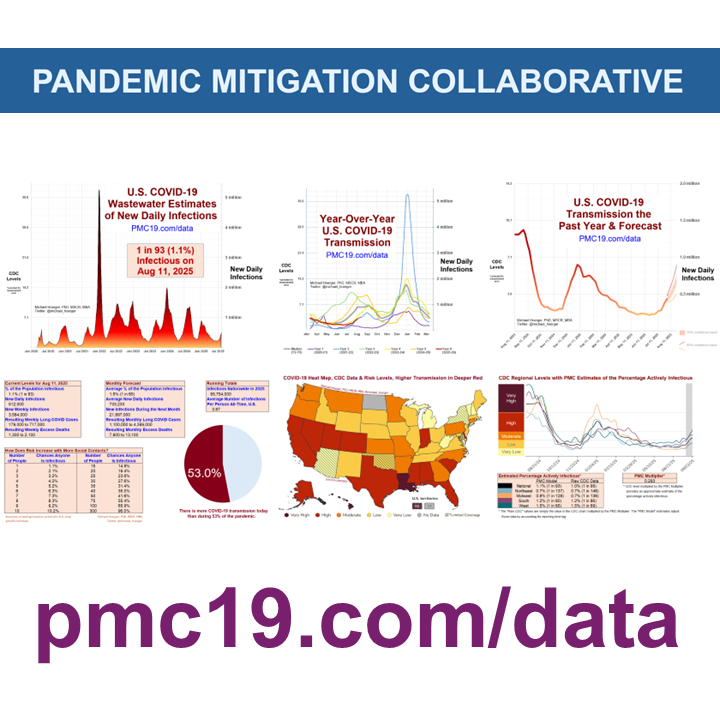
Find the full PMC dashboard online: pmc19.com/data
Please use/improve/share across platforms.
I'm on lG a bit more lately trying to boost C19 awareness, so find me there too.
instagram.com/michael_hoerge…
🧵12/12
Please use/improve/share across platforms.
I'm on lG a bit more lately trying to boost C19 awareness, so find me there too.
instagram.com/michael_hoerge…
🧵12/12
• • •
Missing some Tweet in this thread? You can try to
force a refresh


