
PMC COVlD Dashboard, Sep 22, 2025 (U.S.)
The CDC reports 29 states & DC are experiencing High or Very High transmission.
The heat map is a patchwork quilt with COVlD levels varying considerably state by state.
Transmission is shifting north + east.
🧵1/8
The CDC reports 29 states & DC are experiencing High or Very High transmission.
The heat map is a patchwork quilt with COVlD levels varying considerably state by state.
Transmission is shifting north + east.
🧵1/8

PMC COVlD Dashboard, Sep 22, 2025 (U.S.)
COVlD levels by state, AL to MS.
Note that even levels the CDC calls "Low" like Guam at 1.5% actively infectious are at the threshold where I would tell people who have lapsed that it's time to #MaskUp.
🧵2/8
COVlD levels by state, AL to MS.
Note that even levels the CDC calls "Low" like Guam at 1.5% actively infectious are at the threshold where I would tell people who have lapsed that it's time to #MaskUp.
🧵2/8

PMC COVlD Dashboard, Sep 22, 2025 (U.S.)
COVlD levels by state, Missouri to Wyoming.
New York is a good example of where the CDC label of "Moderate" simply does not cut it. 1 in 49 is very high, and the data quality statewide has been poor.
🧵3/8
COVlD levels by state, Missouri to Wyoming.
New York is a good example of where the CDC label of "Moderate" simply does not cut it. 1 in 49 is very high, and the data quality statewide has been poor.
🧵3/8

PMC COVlD Dashboard, Sep 22, 2025 (U.S.)
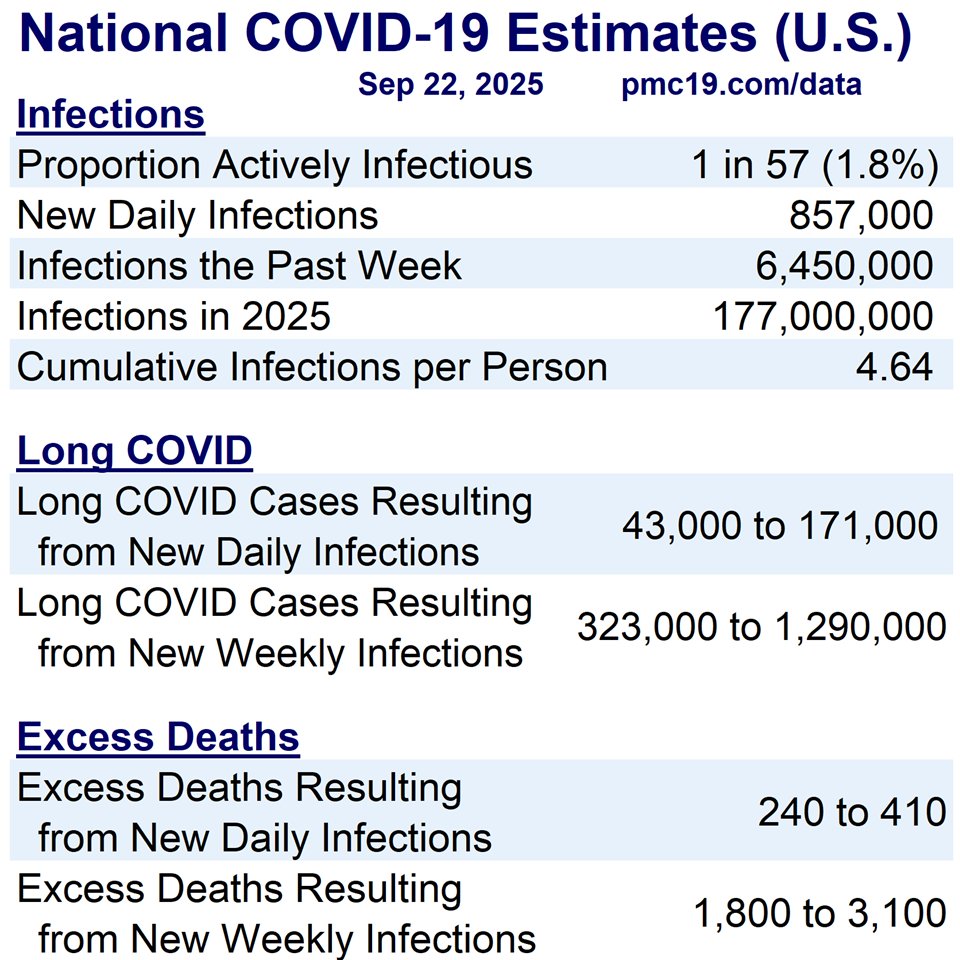
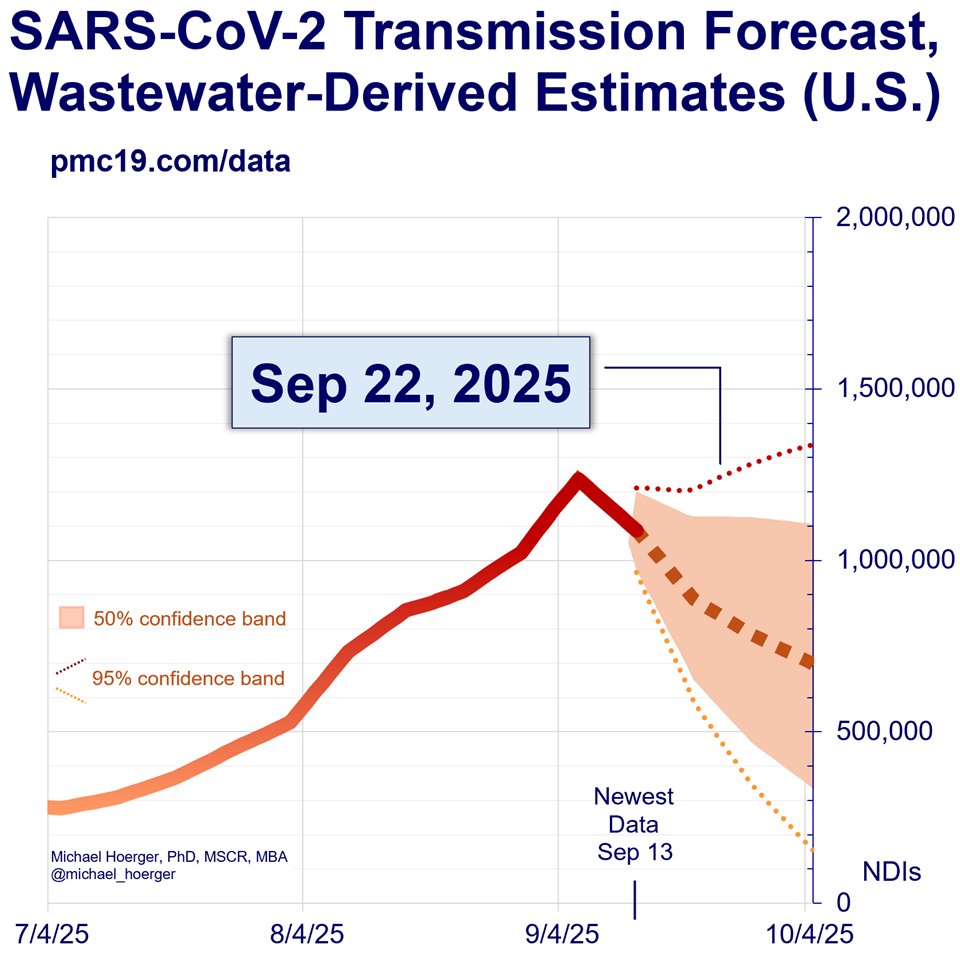
PMC presently estimates transmission peaked on Sep 6 at 1.24 million new daily infections.
Our forecasts were in the range of 1.0-1.3 mil with a peak timed to Sep 6-13, based on rocky & lagged real-time data. Hope it helped you.
🧵4/8
PMC presently estimates transmission peaked on Sep 6 at 1.24 million new daily infections.
Our forecasts were in the range of 1.0-1.3 mil with a peak timed to Sep 6-13, based on rocky & lagged real-time data. Hope it helped you.
🧵4/8

PMC COVlD Dashboard, Sep 22, 2025 (U.S.)
New weekly infections are estimated at 6.5 million nationwide, leading to thousands of new long-term sequelae, and an eventual ≈3,000 excess deaths.
Only about 1 in 44 infections are being reported.
🧵5/8
New weekly infections are estimated at 6.5 million nationwide, leading to thousands of new long-term sequelae, and an eventual ≈3,000 excess deaths.
Only about 1 in 44 infections are being reported.
🧵5/8
PMC COVlD Dashboard, Sep 22, 2025 (U.S.)
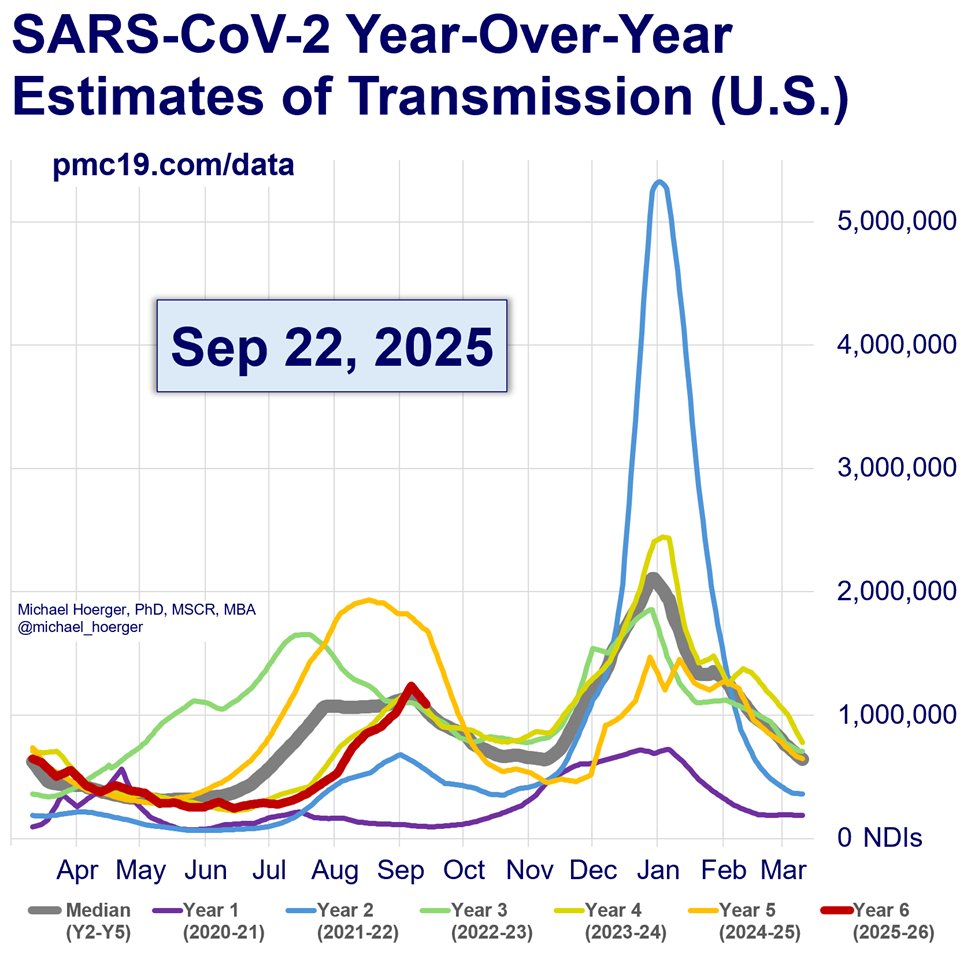
Current SARS-CoV-2 transmission (red line) is eerily tracking that of 2 years ago (yellow).
The good news is the sudden apparent decline from peak transmission. To see the bad news track the yellow line's autumn "lull."
🧵6/8
Current SARS-CoV-2 transmission (red line) is eerily tracking that of 2 years ago (yellow).
The good news is the sudden apparent decline from peak transmission. To see the bad news track the yellow line's autumn "lull."
🧵6/8
PMC COVlD Dashboard, Sep 22, 2025 (U.S.)
Our central forecast has national transmission declining steadily the next several weeks, but there is considerable statewide variation.
Historically, 60% of SARS-CoV-2 transmission occurs on the back end of waves.
🧵7/8
Our central forecast has national transmission declining steadily the next several weeks, but there is considerable statewide variation.
Historically, 60% of SARS-CoV-2 transmission occurs on the back end of waves.
🧵7/8
PMC COVlD Dashboard, Sep 22, 2025 (U.S.)
Protect yourself. You have value. The long-term benefits of reducing cumulative reinfections are tremendous.
The vast majority of PMC dashboard users protect themselves with multilayered mitigation.
🧵8/8
Protect yourself. You have value. The long-term benefits of reducing cumulative reinfections are tremendous.
The vast majority of PMC dashboard users protect themselves with multilayered mitigation.
🧵8/8

• • •
Missing some Tweet in this thread? You can try to
force a refresh


