
PMC COVlD Update, Week of Oct 6, 2025 (U.S.)
🧵1/9
An estimated 1 in 81 people are actively infectious during the ongoing 11th wave.
The "shutdown" has created a blackout at the state level.
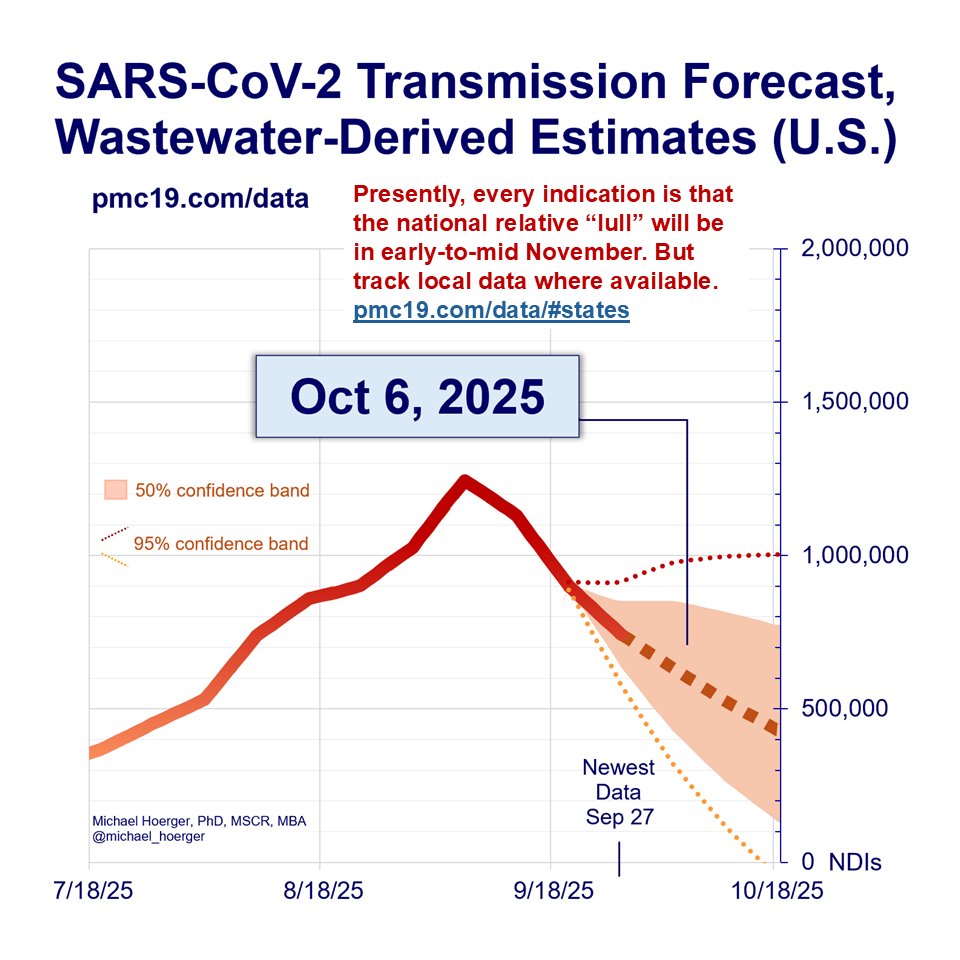
Transmission is half that of the peak one month ago, and we anticipate a relative national "lull" in early-to-mid November, albeit still at dangerous levels.
Our model uses a combination of CDC and Biobot data, so we are able to estimate national statistics despite the CDC data going offline. On the map, note that Puerto Rico continues to update; they use a CDC-style system but were dropped by the CDC long ago. For full methodology, review the technical appendix on the website.
🧵1/9
An estimated 1 in 81 people are actively infectious during the ongoing 11th wave.
The "shutdown" has created a blackout at the state level.
Transmission is half that of the peak one month ago, and we anticipate a relative national "lull" in early-to-mid November, albeit still at dangerous levels.
Our model uses a combination of CDC and Biobot data, so we are able to estimate national statistics despite the CDC data going offline. On the map, note that Puerto Rico continues to update; they use a CDC-style system but were dropped by the CDC long ago. For full methodology, review the technical appendix on the website.

PMC COVlD Update, Week of Oct 6, 2025 (U.S.)
🧵2/9
#DuringCOVID is today. We estimate >600,000 new daily infections. This is about half the peak on September 6.
Notice current levels are similar to the estimated peaks of the first 3 waves.
🧵2/9
#DuringCOVID is today. We estimate >600,000 new daily infections. This is about half the peak on September 6.
Notice current levels are similar to the estimated peaks of the first 3 waves.

PMC COVlD Update, Week of Oct 6, 2025 (U.S.)
🧵3/9
Weekly estimates:
🔹4.5 million infections
🔹>200,000 resulting long-term health conditions
🔹>1,300 resulting excess deaths
🧵3/9
Weekly estimates:
🔹4.5 million infections
🔹>200,000 resulting long-term health conditions
🔹>1,300 resulting excess deaths

PMC COVlD Update, Week of Oct 6, 2025 (U.S.)
🧵4/9
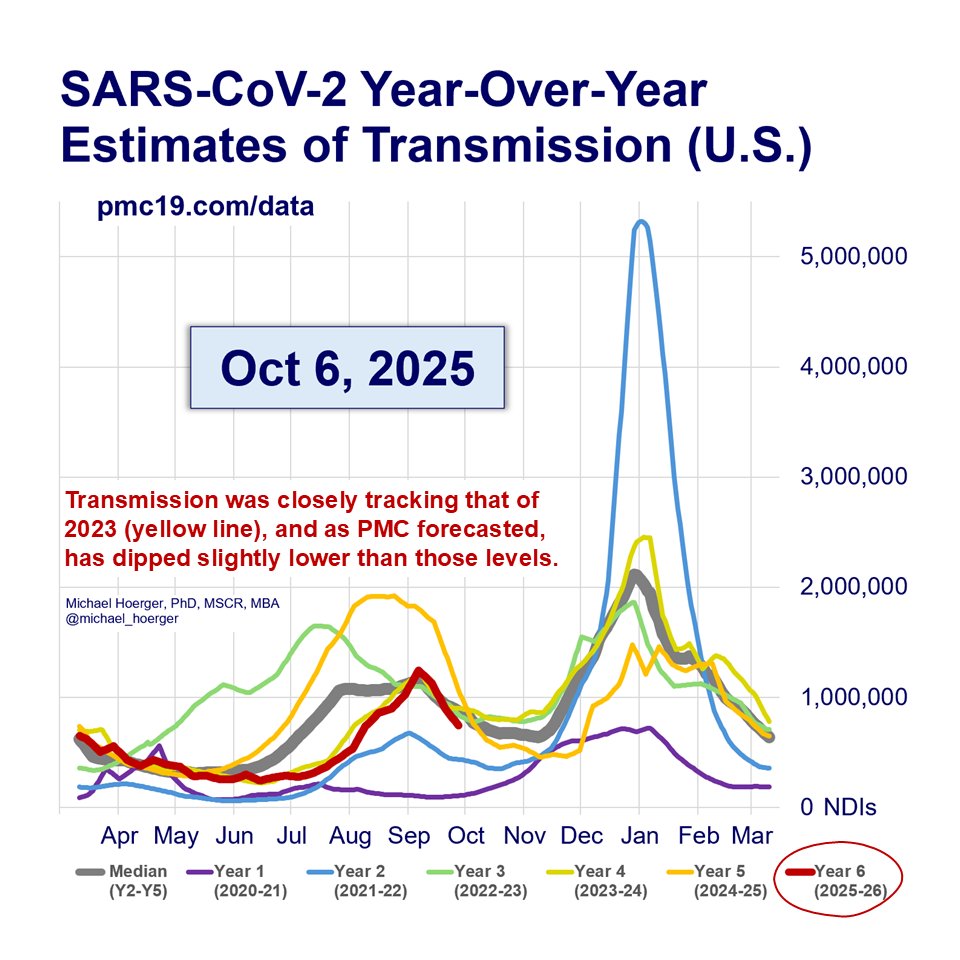
Current estimates have closely tracked those of 2023. However, as we forecasted, they are starting to dip a bit lower.
Notice the relative national "lull" generally in early November.
🧵4/9
Current estimates have closely tracked those of 2023. However, as we forecasted, they are starting to dip a bit lower.
Notice the relative national "lull" generally in early November.
PMC COVlD Update, Week of Oct 6, 2025 (U.S.)
🧵5/9
We forecast dipping below 500,000 new daily infections in a couple weeks. These estimates are volatile without the CDC data.
🧵5/9
We forecast dipping below 500,000 new daily infections in a couple weeks. These estimates are volatile without the CDC data.
PMC COVlD Update, Week of Oct 6, 2025 (U.S.)
🧵6/9
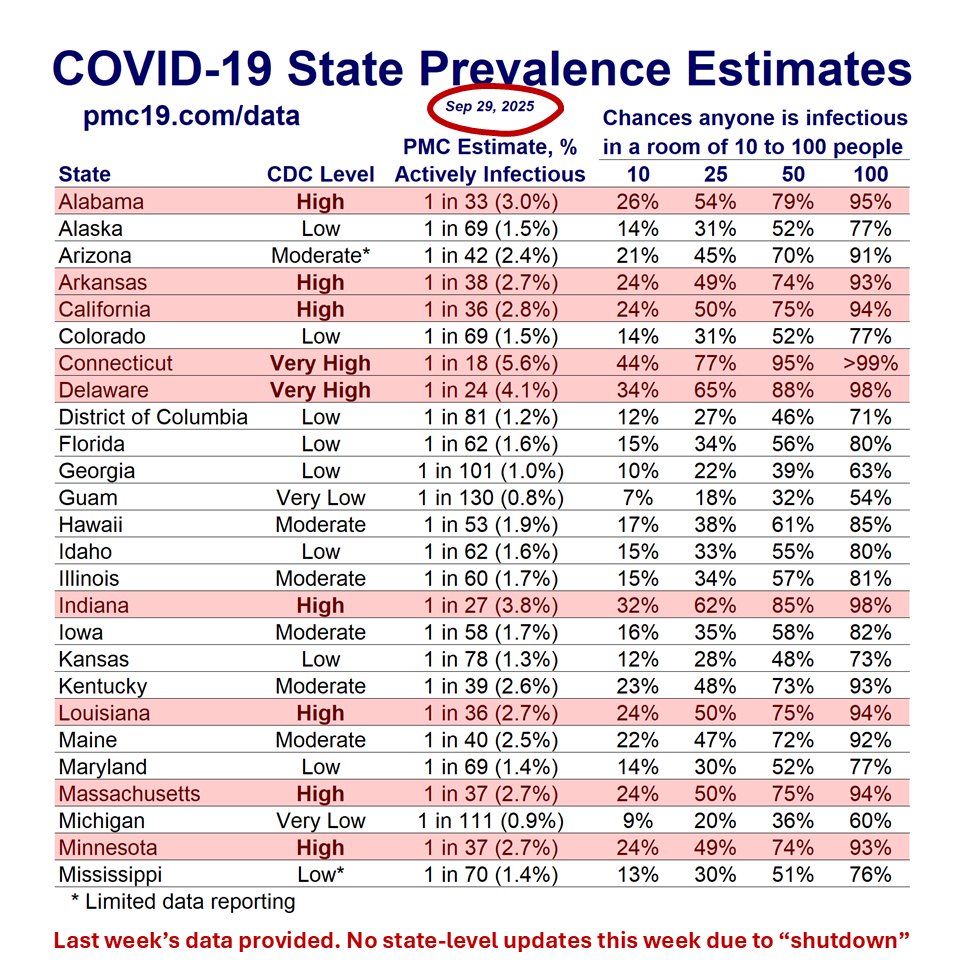
There are no state-level updates this week. You may find last week's estimates helpful. In general, transmission is about 25% lower, but it's hard to know how much lower (or higher) in each state.
🧵6/9
There are no state-level updates this week. You may find last week's estimates helpful. In general, transmission is about 25% lower, but it's hard to know how much lower (or higher) in each state.
PMC COVlD Update, Week of Oct 6, 2025 (U.S.)
🧵7/9
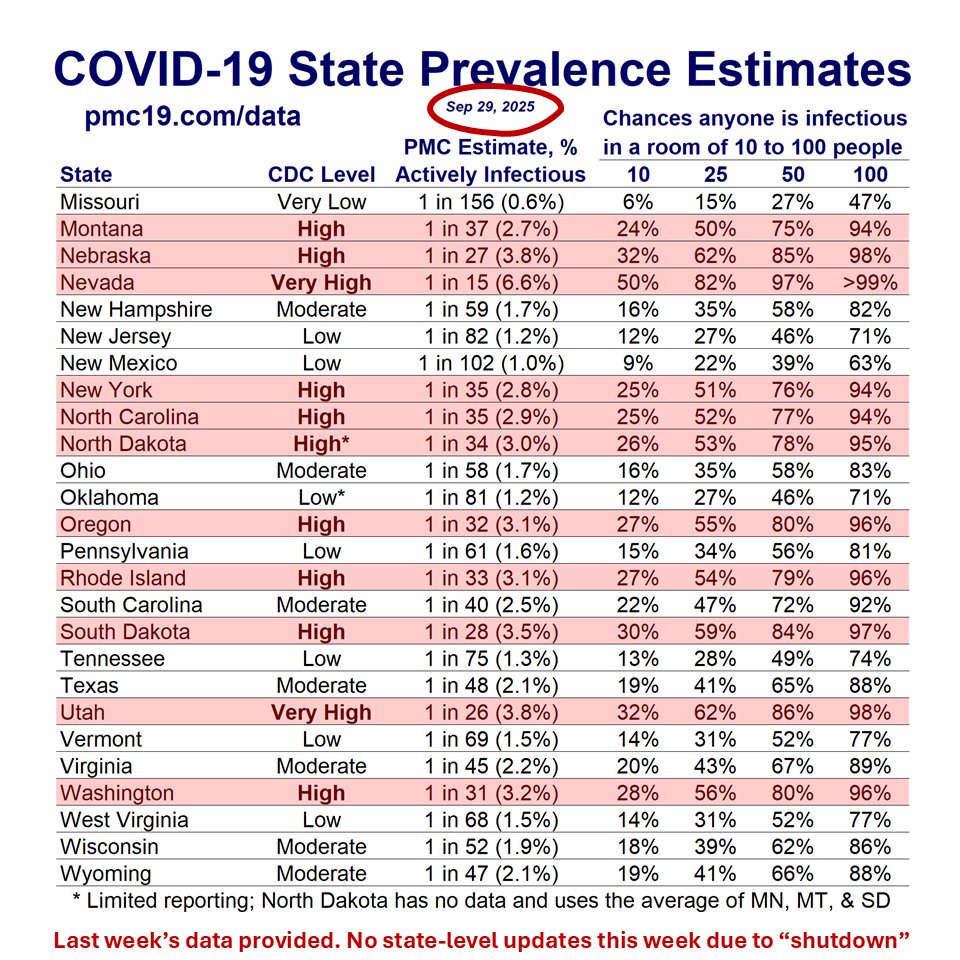
Table continued.
There are no state-level updates this week. You may find last week's estimates helpful. In general, transmission is about 25% lower, but it's hard to know how much lower (or higher) in each state.
🧵7/9
Table continued.
There are no state-level updates this week. You may find last week's estimates helpful. In general, transmission is about 25% lower, but it's hard to know how much lower (or higher) in each state.
PMC COVlD Update, Week of Oct 6, 2025 (U.S.)
🧵8/9
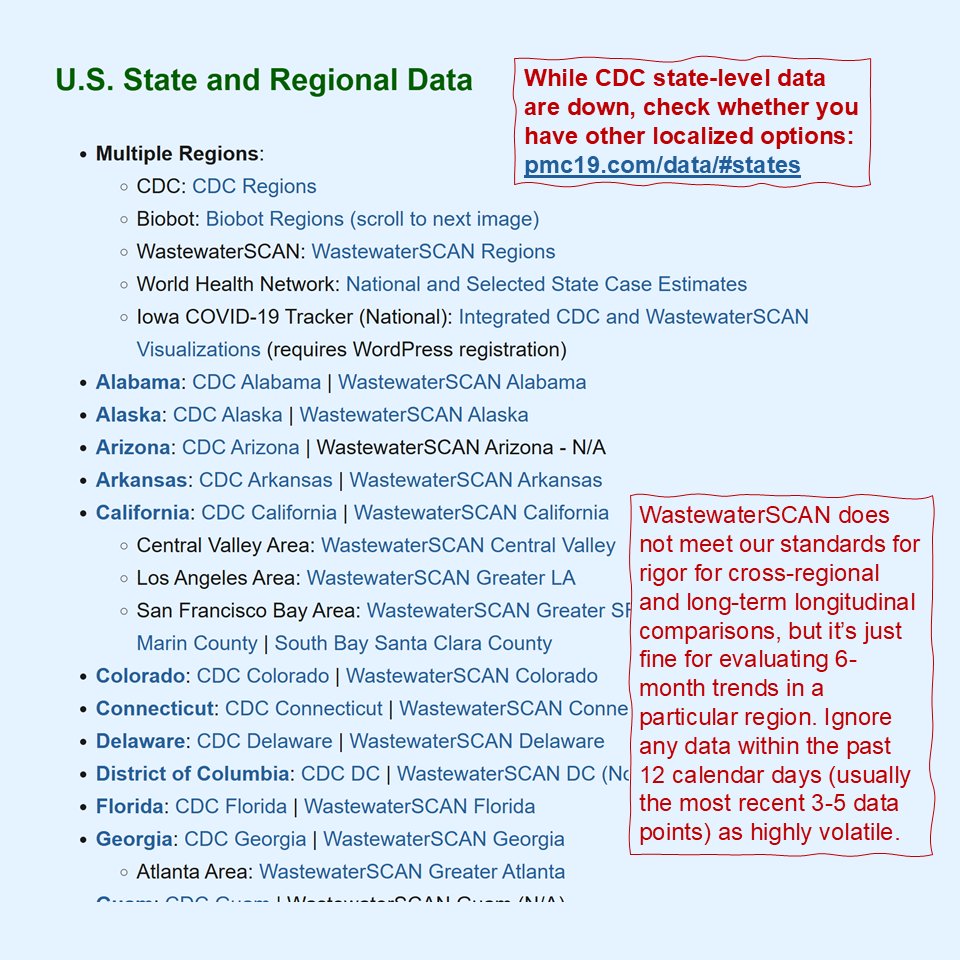
Amid the CDC blackout, you can still find some state-level data through other sources.
See
There are state and international resources if you just scroll way down the dashboard page. pmc19.com/data/#states
🧵8/9
Amid the CDC blackout, you can still find some state-level data through other sources.
See
There are state and international resources if you just scroll way down the dashboard page. pmc19.com/data/#states
PMC COVlD Update, Week of Oct 6, 2025 (U.S.)
🧵9/9
3 state pharmacy boards are continuing to block access to boosters unless one has a prescription (& "high-risk" condition).
Please contact them to complain. Help keep our Louisiana-based team safer. 🙏
🧵9/9
3 state pharmacy boards are continuing to block access to boosters unless one has a prescription (& "high-risk" condition).
Please contact them to complain. Help keep our Louisiana-based team safer. 🙏
https://x.com/michael_hoerger/status/1974199341989699921
• • •
Missing some Tweet in this thread? You can try to
force a refresh


