Really_Bad_At_Names, Good at Science🦎 Profile picture
Oct 26 4 tweets 2 min read Read on X
#climatebrawl
#ClimateScam
Possible the most common mistake scientific illiterates and fraudulent "physical scientists" make is conflating pressure with temperature.
Hate to break it to you guys, the earth is not a snow globe... the atmosphere has no fixed top
1 Image
Image
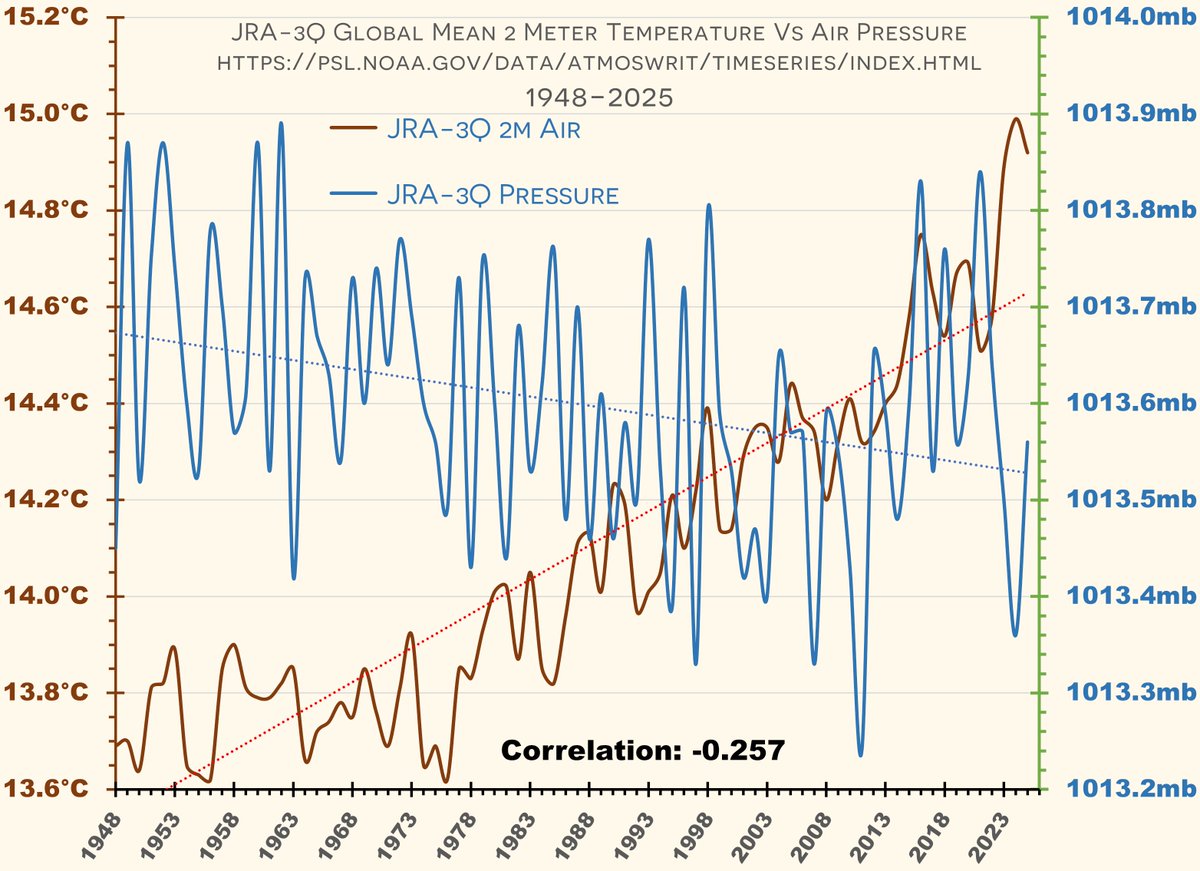
Two charts, sourced from the JRA-3Q (3 1/4s of a century) database:
1) 2 meters above the surface mean global temperatures, vs 2 meters above the surface average global air pressure.
Note the extreme disparity in charts- there's a negative coefficient
2
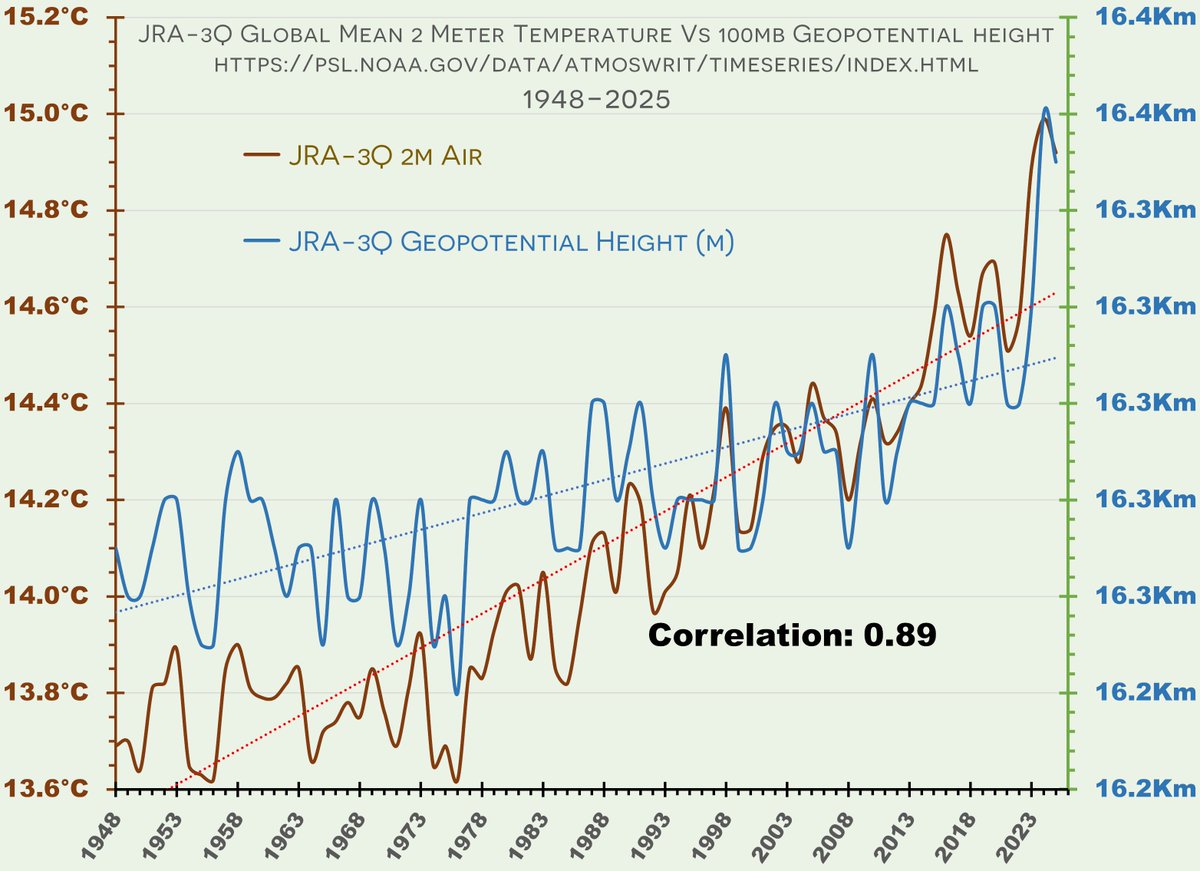
2) The second chart shows 2 meter temps vs the average global height in the atmosphere where air pressures are 100mb (roughly 10% of what it is on the surface) the two lines are almost in perfect synchronization, as the surface warms the atmosphere expands upwards.
3
Why does this matter?
The atmosphere obeys the "ideal gas law" despite the silly claims of science deniers and it grows in volume as temperatures rise- pressure can't cause temperature to rise when pressure adjusts to temperature.
The perpetual motion machine is destroyed

• • •

Missing some Tweet in this thread? You can try to force a refresh
 

Keep Current with Really_Bad_At_Names, Good at Science🦎

Really_Bad_At_Names, Good at Science🦎 Profile picture

Stay in touch and get notified when new unrolls are available from this author!

Read all threads

This Thread may be Removed Anytime!

PDF

Twitter may remove this content at anytime! Save it as PDF for later use!

Try unrolling a thread yourself!

how to unroll video
  1. Follow @ThreadReaderApp to mention us!

  2. From a Twitter thread mention us with a keyword "unroll"
@threadreaderapp unroll

Practice here first or read more on our help page!

More from @25_cycle

Oct 1
#Climatebrawl
#ClimateScam

An explainer why this low-information loser and all others who claim there's no greenhouse gas effect are as ignorant and wrong as humanly possible.
To do this right, I'm going to break down the last 25 years of CERES satellite data on LW&SW
1
2
Simple intro to planetary climate science- sun irradiates earth with mostly visible light, some IR, some UV. Sun's approx surface temperature is 5778k (~5500°C) the light coming from the sun has a spectral distribution in "short wavelengths" as such:
sunwindsolar.com/blog/solar-rad…Image
Some of that strikes the surface, some reflects off clouds, water, ice and other surfaces. A small amount is absorbed.
About 71% of it is absorbed, the rest bounce back out to space.
3 Image
Read 10 tweets
Jun 4
#ClimateCrisis
A simple explainer that debunks climate denier misinformation.
The claim the Jan 15, 2022 volcano (released 146 billion Kg's water into the stratosphere) is responsible for global warming is beyond ridiculous, borderline insanity. I'll lay out the reasons why:
1/
The earth is 510 million, million square meters in surface area. the stratospheric release equates to ~0.282 grams/m²
Total Atmospheric precipitable water in December 2021: 23,638 grams/m²
That's just more than 1 part in 100,000.
That's less than insignificant!
Water vapor and all greenhouse gases absorb IR emitted from the earth's surface and atmosphere- the higher you go, the less IR remains.
Surface IR is 160W/M², 20 of that is sent to space. Atmospheric is 378W 219W emitted to space, feedback returns 342W to the surface. Image
Read 8 tweets
Apr 18, 2024
#ClimateCrisis
As global temperatures increase, there's a greater risk of human life and economic loss. I will use available EU data to show a pattern that climate change is causing quality of life and risk of death hardships, while switching to renewables can reduce risks
1/7
Start with the economic factors:
Individual years vary greatly, the trend -last 2 years by far the most expensive data is based on fixed 2020€.
How much has it increased?
The last 2 years suffered 1/3rd more economic damage than 1980-1989 combined
2/7
eea.europa.eu/data-and-maps/…
Image
Climate Change & risks to life: Strongly influenced by individual years, there's a slight increase in the trendline but when you consider we've improved building standards, satellite weather forecasting & the ability to warn & evacuate people from harm, this is a concern
3/7
Image
Image
Read 7 tweets
Jan 28, 2024
#ResistanceEarth
#ClimateCrisis
A basic primer on climate science, this is an ongoing Spaces lecture I'm giving each Saturday ~12:30 Eastern Time (UTC-5:00) for the beginner.
This might get long...
1/
The Flight of Icarus
We all know the mythology of Icarus whose wings of feathers & wax melted as he gained altitude and came close to the sun. Never let the truth get in the way of a good story, even the Greeks of antiquity knew the higher you went, the colder it gets.
1/
This is not a feature of middle or high latitude, it’s true in the tropics, there are permanent snow-capped mountains at & near the equator. This paradox troubled scholars for ages, they didn’t know how far the sun was compared to the distance from shore to mountain.
2/
Read 33 tweets
Aug 26, 2023
#ResistanceEarth
#ClimateCrisis
Every day we see posts claiming that CO2 does not have an influence on atmospheric temperature, or "the science isn't settled" but there's no doubt in the scientific community and that's because of 2 centuries of experimentation and theory.
1/
For brevity I will skip the first 100 years and go straight to Canadian Guy Callendar, the first person to quantify the change of radiative forcing in the atmosphere due to changes in CO2. This is the amount of retained IR emitted by the Earth's surface & atmosphere.
2/
The famous "Callendar Equation" was derived by over two painstaking years of research 1936-1938: He determined that the change in radiative forcing is the natural logarithm of relational change in CO2 concentrations, multiplied by 5.35.
This is expressed in Watts/Meter²
3/
Read 8 tweets
May 3, 2023
#ClimateBrawl
#ResistanceEarth
The temperature of Earth's surface, depends upon two relatively easy to measure parameters, energy coming in from the sun, and energy emitted by the Earth's surface and atmosphere.
NASA has a set of satellites measuring these parameters.
1/4
The "easy" one is incoming solar energy- that varies slightly over the course of the entire series and as represented here was (as measured at top of atmosphere) 340.185W/M² + 0.058% / - 0.043%.
2/4 Image
The change in upwelling IR emitted by our surface, oceans, ice, & atmosphere is profoundly changed- the atmosphere is retaining an additional 0.33W/M² per decade, during the satellite's run. That's ~ an additional 1/1000th of the sun's energy being "held back" / decade
3/4 Image
Read 4 tweets

Did Thread Reader help you today?

Support us! We are indie developers!


This site is made by just two indie developers on a laptop doing marketing, support and development! Read more about the story.

Become a Premium Member ($3/month or $30/year) and get exclusive features!

Become Premium

Don't want to be a Premium member but still want to support us?

Make a small donation by buying us coffee ($5) or help with server cost ($10)

Donate via Paypal

Or Donate anonymously using crypto!

Ethereum

0xfe58350B80634f60Fa6Dc149a72b4DFbc17D341E copy

Bitcoin

3ATGMxNzCUFzxpMCHL5sWSt4DVtS8UqXpi copy

Thank you for your support!

Follow Us!

:(