Smirkley Profile picture
Mar 16 6 tweets 2 min read Read on X
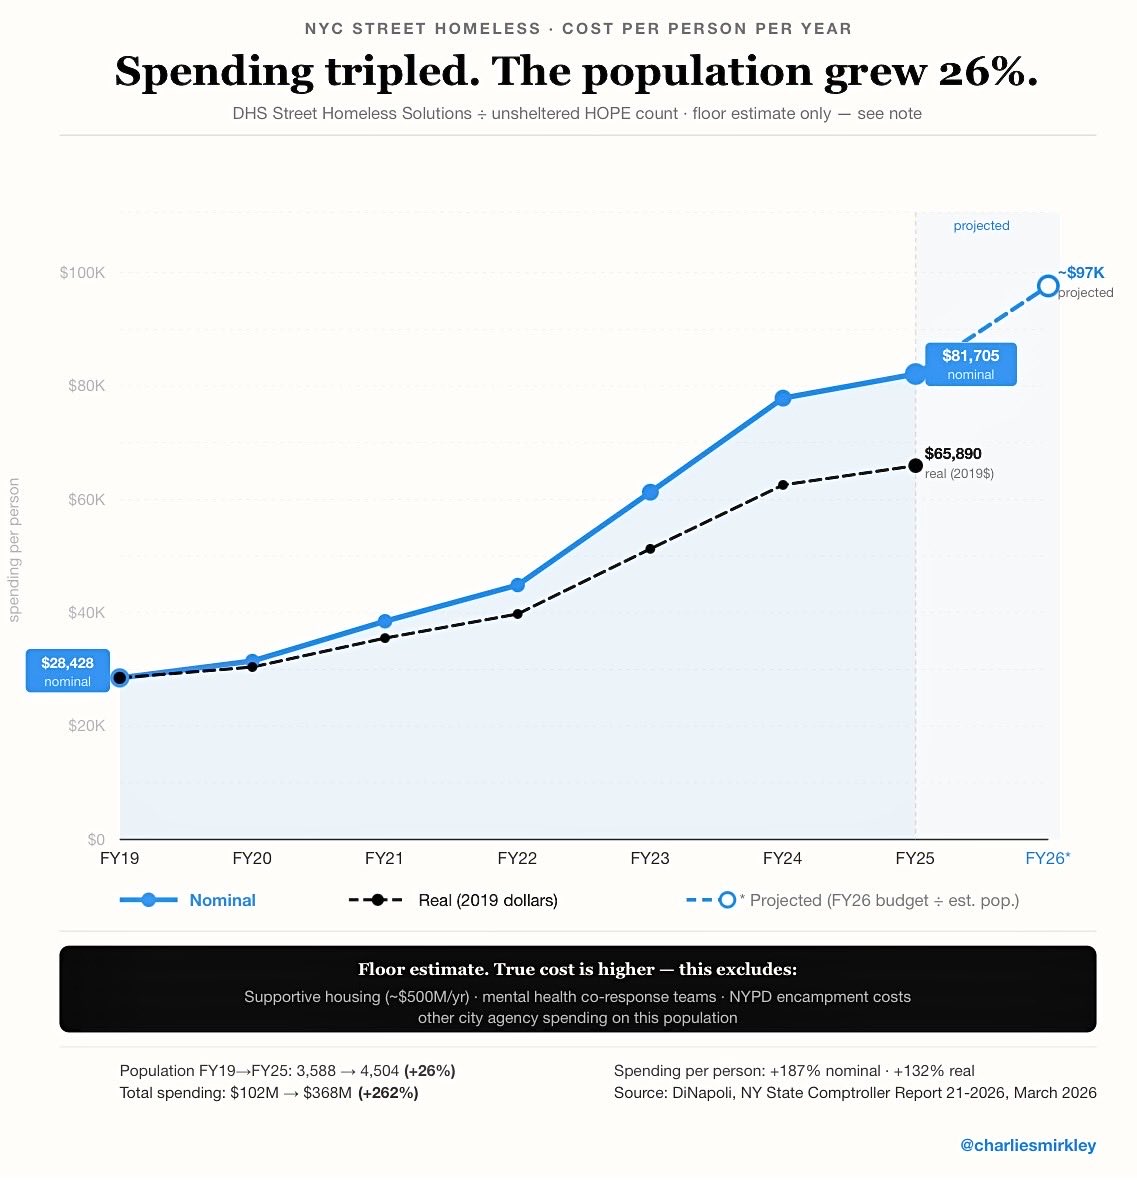
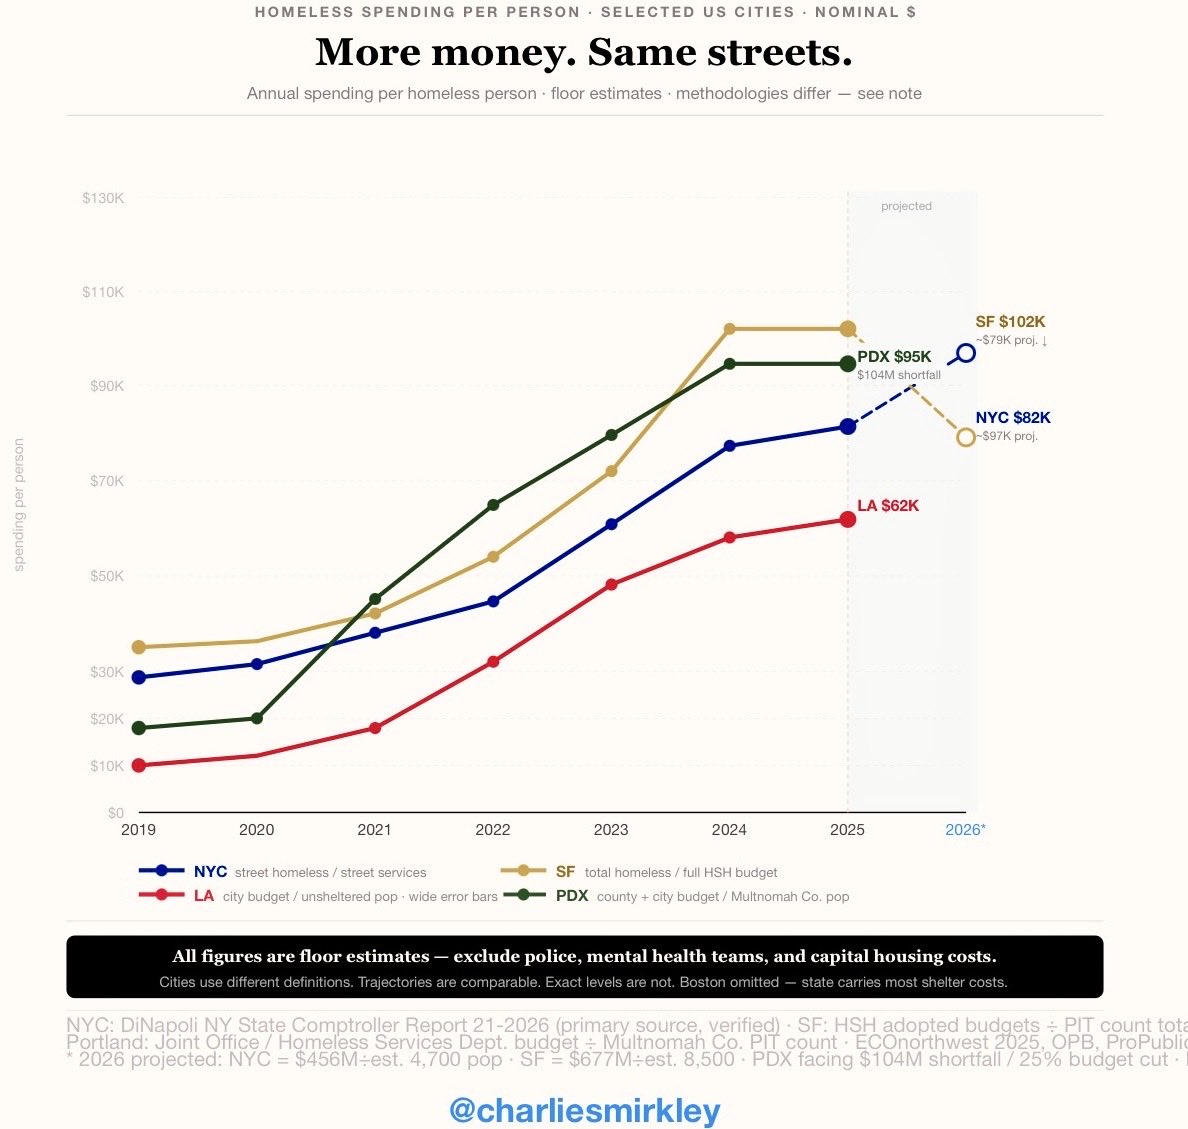
NYC spends more per homeless person than the median NYC household earns. $81,705 per person in FY2025.

And $81,705 is a floor. It excludes supportive housing (~$500M/yr), mental health response teams, and NYPD encampment costs.

The city projects ~$97K per person in FY2026. NYC spending per street homeless person from FY2019 to FY2025 with FY2026 projected. Blue solid line rises from $28,428 in FY2019 to $81,705 in FY2025 — higher than the median NYC household income of ~$76,000. Dashed blue extension projects ~$97,000 in FY2026. Black dashed line shows inflation-adjusted real dollars ending at $65,890. Black note box states this is a floor estimate excluding supportive housing (~$500M/yr), mental health co-response teams, and NYPD costs. Bottom stats: population +26%, total spending +262%. Source: NY State Comptroller DiNapoli, March 2026.
Spending per homeless person since 2019:
NYC +187%, SF +190%, PDX +430%, LA +480%. Average: +320

Floor estimates.

Homeless pop over same period: +13%

Spending up ~320%. Problem up ~13%. Homeless spending since 2019 has surged.
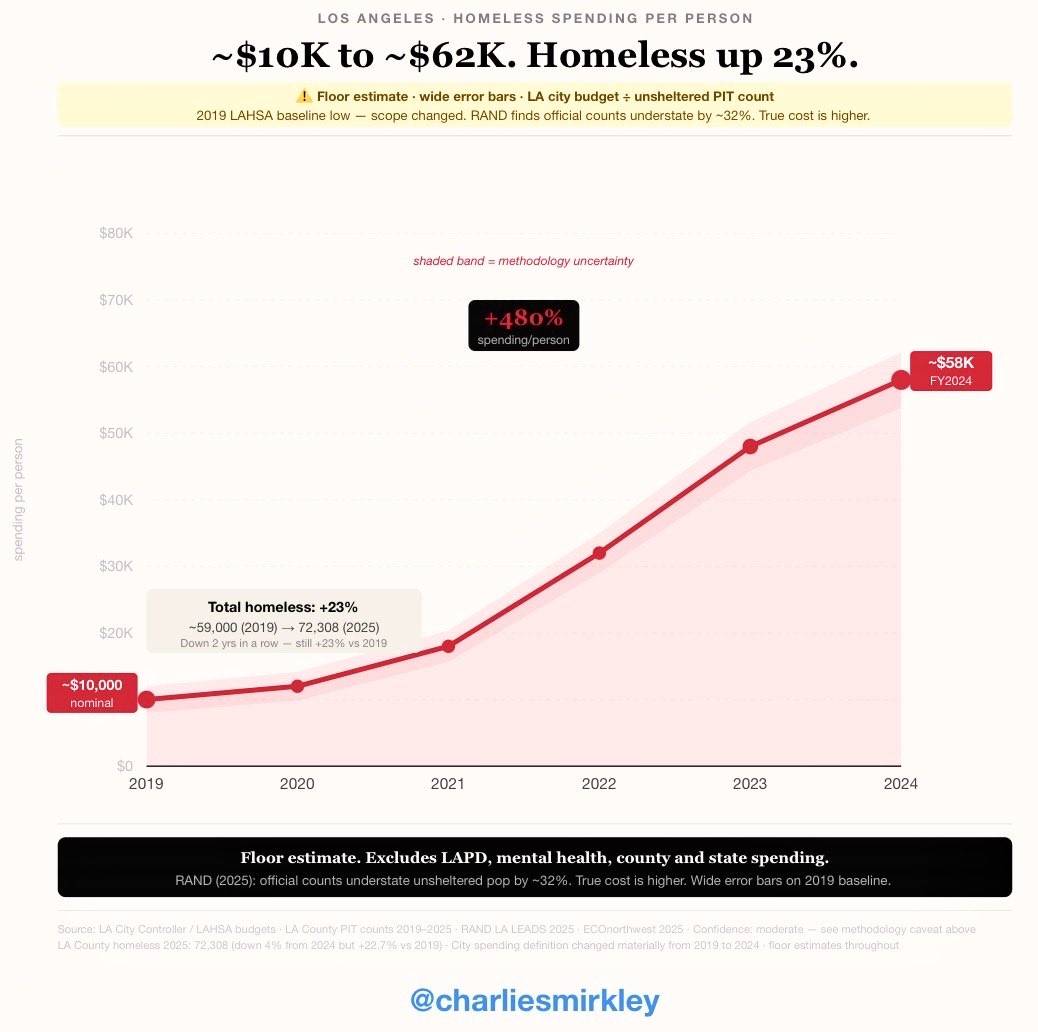
LA: ~$10K per homeless person in 2019. ~$62K in 2024. +480%.

LA County homeless pop: +23%.
RAND’s count finds LA’s official figures understate the pop by 32%.

Floor estimate, excludes LAPD, mental health teams, county and state spending. Los Angeles homeless spending per person from 2019 to 2024 in LA. Rises from $10,000 in 2019 to ~$62,000 in 2024
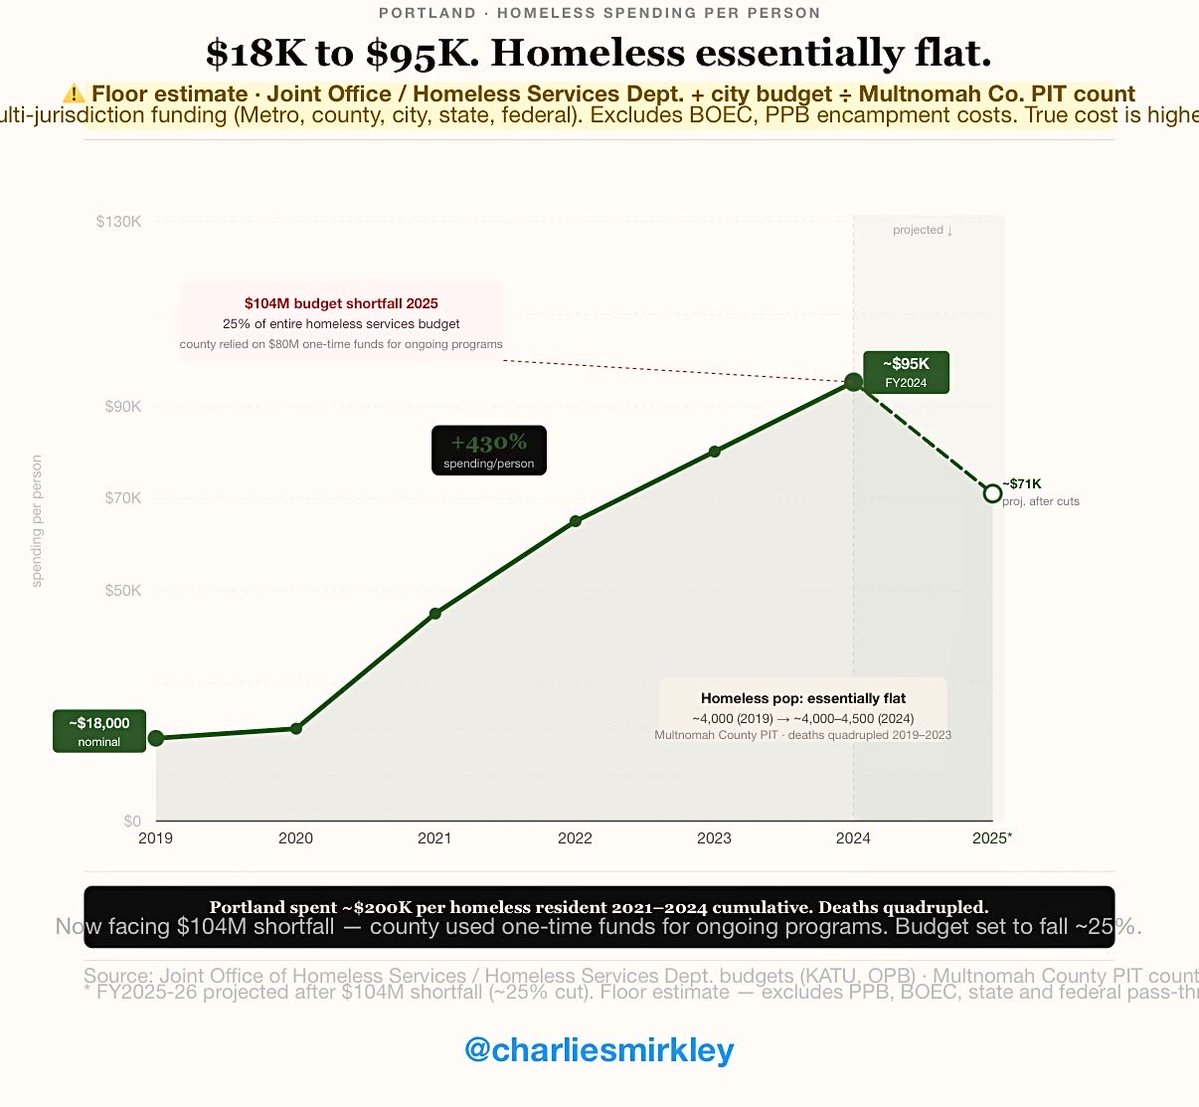
Portland: ~$18K per homeless person in 2019. ~$95K in 2024. +430%.

Homeless pop: essentially flat. Deaths of homeless quadrupled.

Floor estimate excludes Portland police, BOEC, state and federal pass-through costs.

Sources: OPB · ECOnorthwest 2025 · ProPublica 2025. Portland/Multnomah County homeless spending per person from 2019 to 2024, with a dashed projected decline in 2025 following a $104M budget shortfall. Rises steeply from $18,000 in 2019 to ~$95,000 in 2024, then projects down to 71K after the 25% budget.
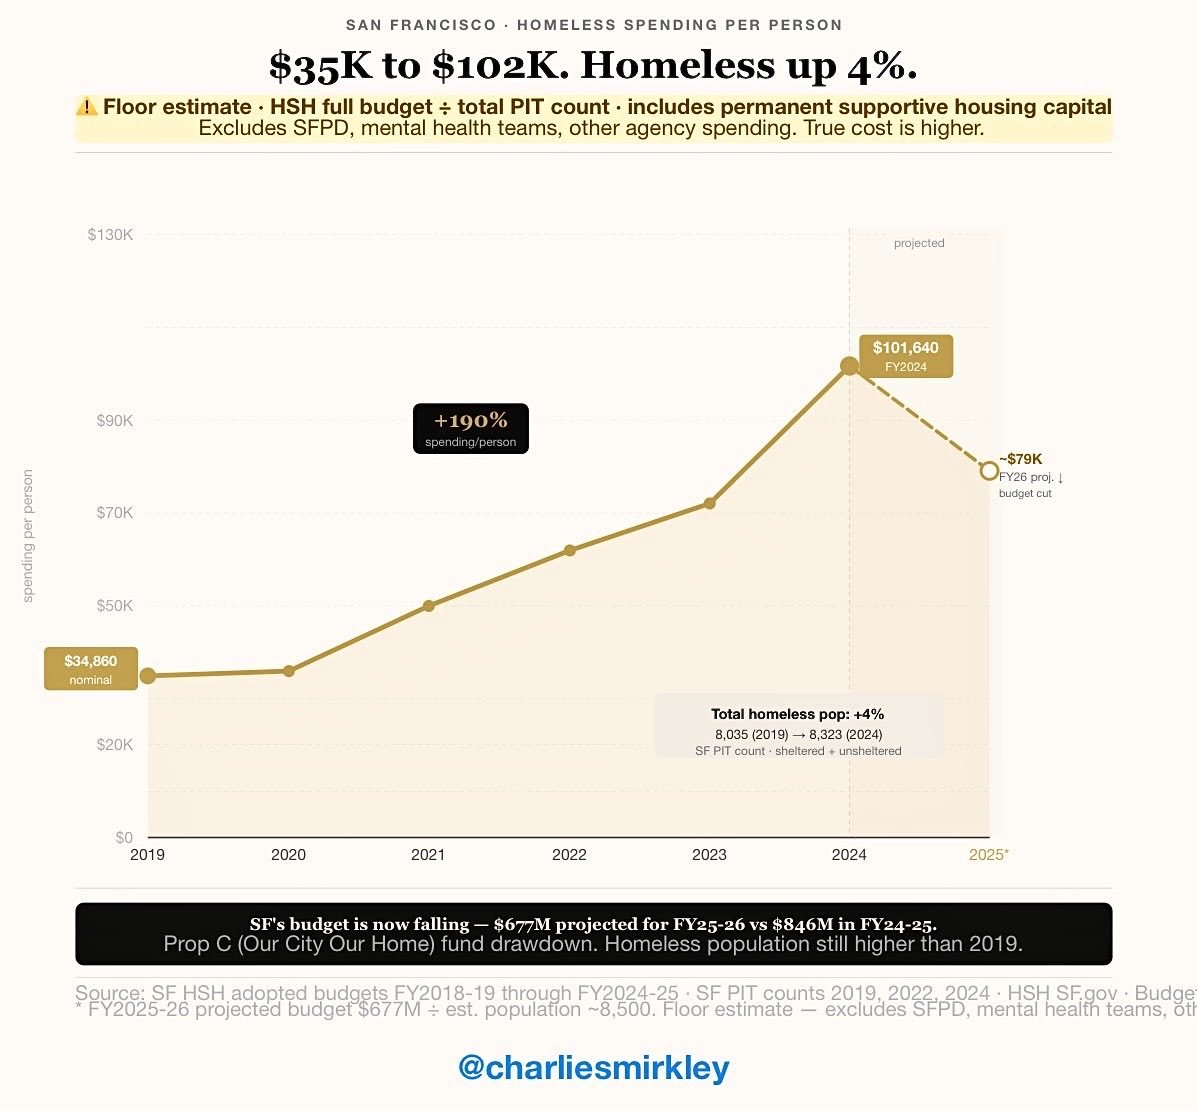
San Fran: 35K per homeless person in 2019. $102K in 2024. +190%. Floor estimates.

Total homeless pop over the same period: up 4%.

Source: SF HSH budgets · SF PIT counts San Fran homeless spending
I blame the rising cost per homeless person on:
Fentanyl/drugs (intransigence multiplier).
NGO incentive misalignment (reward service not solution).
Housing First ideology (religious belief now).
SMI revolving door (deinstitutionalisation never fixed).
Cost disease.

• • •

Missing some Tweet in this thread? You can try to force a refresh

 

Keep Current with Smirkley

Smirkley Profile picture

Stay in touch and get notified when new unrolls are available from this author!

Read all threads

This Thread may be Removed Anytime!

PDF

Twitter may remove this content at anytime! Save it as PDF for later use!

Try unrolling a thread yourself!

how to unroll video
  1. Follow @ThreadReaderApp to mention us!

  2. From a Twitter thread mention us with a keyword "unroll"
@threadreaderapp unroll

Practice here first or read more on our help page!

More from @Smirkley

Jun 21
77% of the far-left born 1990 or after now claim no religion at all. On the far right it’s 11%. WNH only. Bar chart, no religion by ideology, white non-Hispanic born 1990+, 77% far-left down to 11% far-right. GSS (NORC). @smirkley
46% of the far right born 1990+ attend weekly or more vs just 3% of the far left. WNH only. chart, weekly+ attendance by ideology, white non-Hispanic born 1990+, 3% far-left up to 46% far-right. GSS (NORC). @smirkley
White non-Hispanic, by ideology, born 1990+

85% of extreme conservatives do not doubt God exists vs 0% of extreme liberals. Image
Read 8 tweets
Jun 12
87 nationalities had a higher sexual offence conviction rate than the British population, which already includes non-whites. Do you think the myth buster mentioned this “myth.”

No she whined about search disparities because she can’t figure out what an appropriate base rate is. Image
If a visa/asylum system imports a disproportionately young-male pop, the unadjusted crime contribution is policy relevant. Using adjusted stats is unless you’re switching to importing grandmothers from Sudan.
The number of foreign nationals in prison is shaped by policies that allow, at least some, prisoners to be deported before the end of their sentences. Does this happen with Native Brits?

Are you rehearsing for a job at Cato?
Read 5 tweets
Jun 12
Somalis in Canada are getting an entire month in their honor. And don’t you think it’s about time? Look at the economic impact.

58.5% of Somali men had zero employment income a full decade in Canada. Zero.

Here is how they stack against other refugees. Share of refugee men with no earnings. Source: Statistics Canada. @smirkley
7 in 10 Somali women reported no earnings 10 years in. Zero. Share of refugee women with no earnings. Source: Statistics Canada. @smirkley
StatCan tracked every major refugee cohort to Canada, 1980-2009. Earnings per adult man 10 years after landing: Somalia men $11.2k? That can’t be right. Refugee earnings per adult man by source country. Source: Statistics Canada. @smirkley
Read 4 tweets
Jun 11
Denmark publishes crime by country of origin, not nationality. I looked at 2021-2025 data.

Overall: Somali-origin 7.8x the Danish rate. American-origin 0.34x.

Thread of Top Five and Bottom Five. Penal code conviction rates by origin, Denmark. Statistics Denmark STRAFNA4, 2021-205. @smirkley
Violence in Denmark:

Somali-origin 9.2x the Danish rate.

American & German-origin ~0.3x.

Note: Lebanon = Palestinians via Lebanon mostly Violence conviction rates by origin, Denmark. @Smirkley
Grievous assault in Denmark:

Somali-origin 19.3x the Danish rate. Lebanese 11.9x, Moroccan 7.5x.

American-origin 0.18x. Imagine being 100x more violent than Americans! Grievous assault conviction rates by origin, Denmark
Read 10 tweets
May 31
12 years ago, a woman made and released a viral video documenting street harassment in New York.

Liberals noticed, because their ability to notice only goes so far, that almost all of the catcallers shown were black or Hispanic. So they called her racist.

To placate the mob, she suggested white men behaved similarly and promised the release of follow-up footage. She never did. For the obvious reason that it didn’t exist.
Receipts part one because people are saying I’m lying. Image
Image
Image
Image
Image
Image
Image
Image
Read 4 tweets
May 13
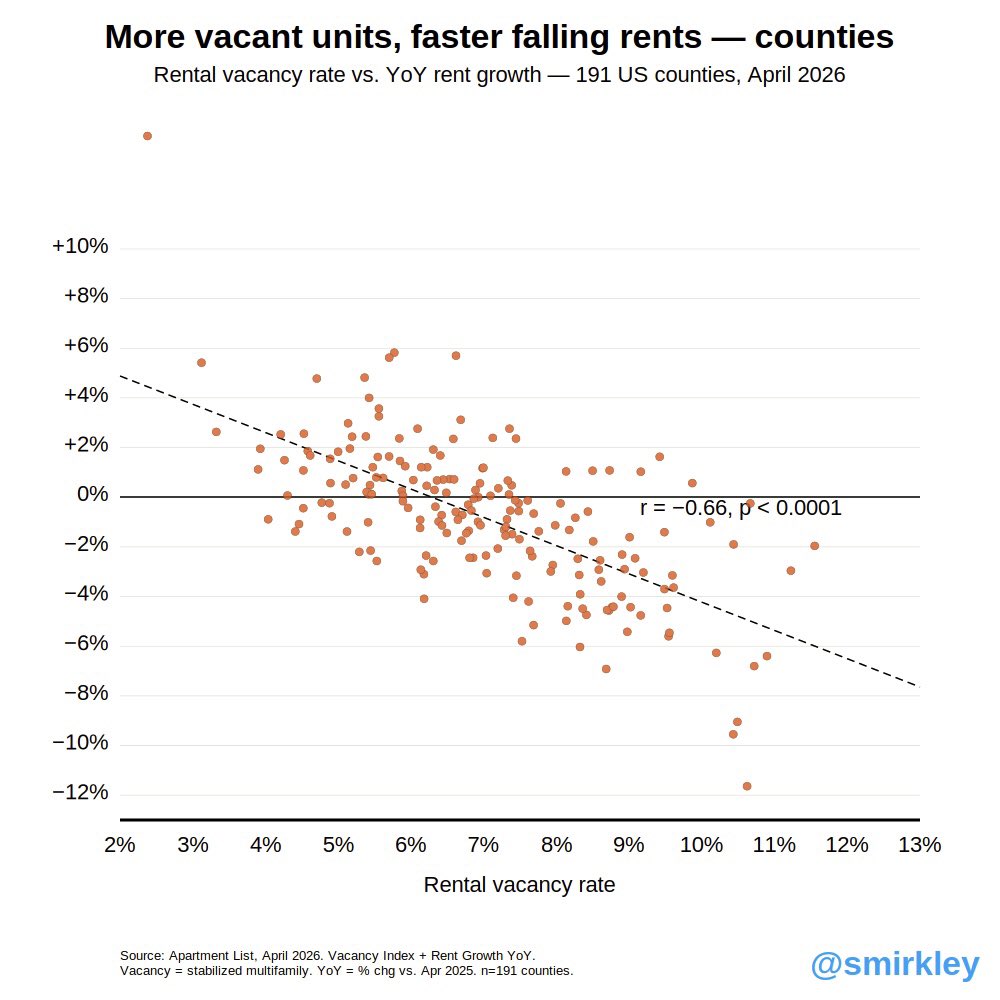
Supply & demand works.
191 US counties: more vacant rental units means faster falling rents. r = −0.66. @smirkley scatter plot, Apartment List April 2026 data, 191 US counties showing rental vacancy rate versus year-over-year rent growth, strong negative correlation r equals negative 0.66
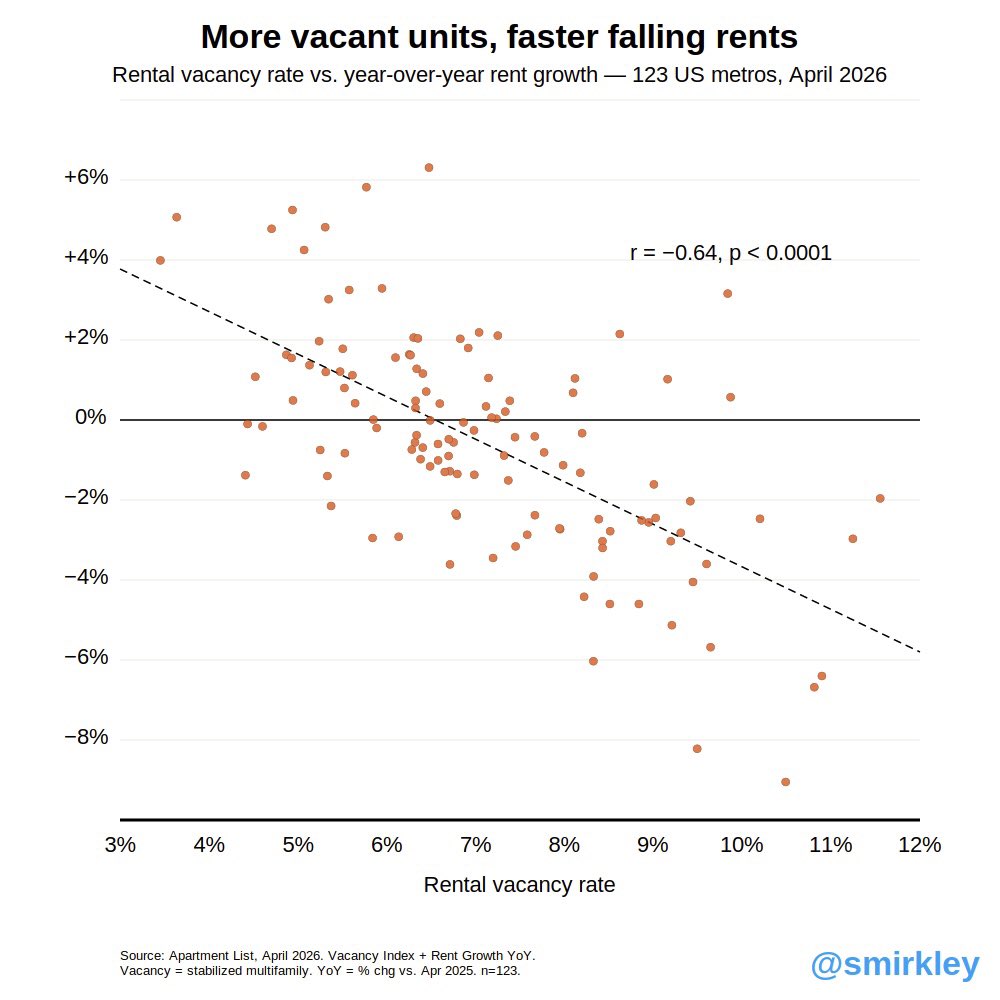
Same story at the metro level. 123 markets. r = -0.64 @smirkley scatter chart from Apartment List April 2026, 123 US metros, rental vacancy rate on x-axis, year-over-year rent growth on y-axis, Pearson r negative 0.64, clear downward trend line
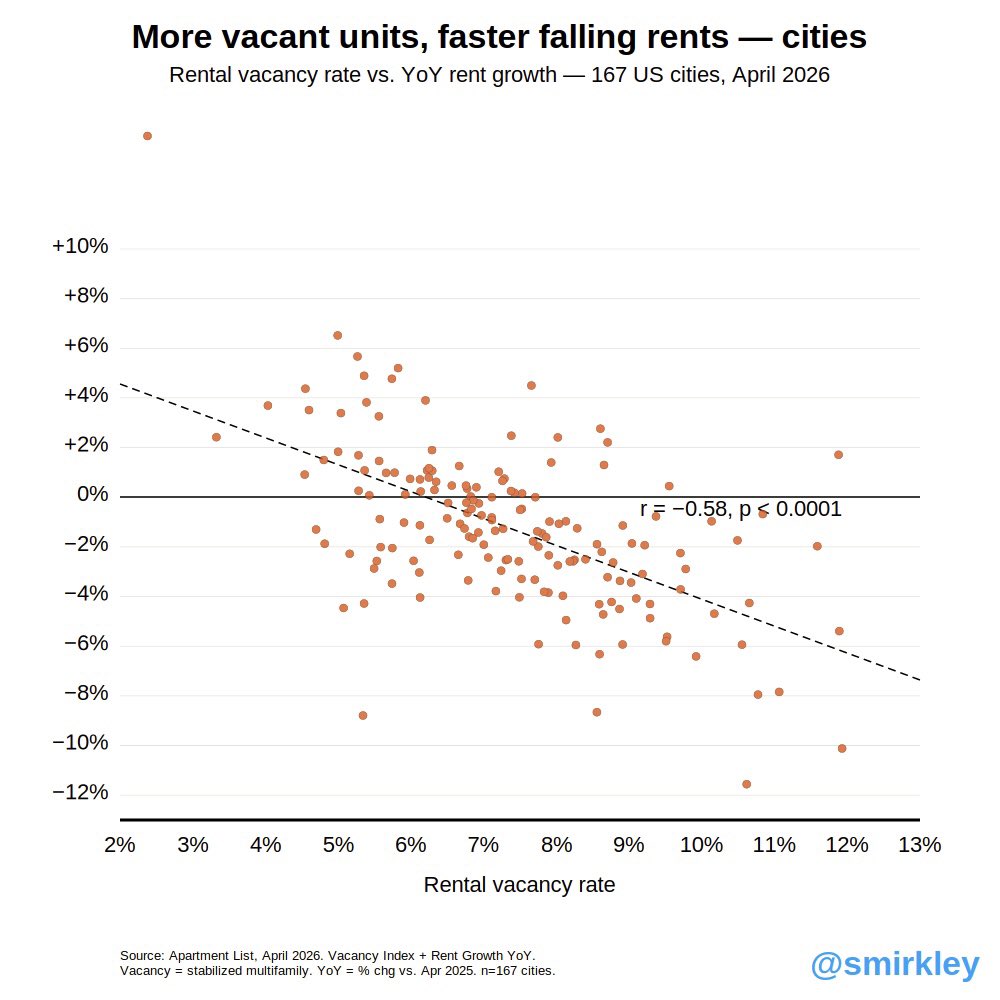
Holds at city level too. 167 US cities, r = −0.58.
Every 1pp of extra vacancy = rents falling ~1.1pp faster year-over-year. smirkley data visualization using Apartment List 2026 vacancy and rent growth figures for 167 US cities, scatter plot showing negative correlation between rental vacancy and rent change, r equals negative 0.58.
Read 6 tweets

Did Thread Reader help you today?

Support us! We are indie developers!


This site is made by just two indie developers on a laptop doing marketing, support and development! Read more about the story.

Become a Premium Member ($3/month or $30/year) and get exclusive features!

Become Premium

Don't want to be a Premium member but still want to support us?

Make a small donation by buying us coffee ($5) or help with server cost ($10)

Donate via Paypal

Or Donate anonymously using crypto!

Ethereum

0xfe58350B80634f60Fa6Dc149a72b4DFbc17D341E copy

Bitcoin

3ATGMxNzCUFzxpMCHL5sWSt4DVtS8UqXpi copy

Thank you for your support!

Follow Us!

:(