A couple of things to say about the fall in stop and search disproportionality...
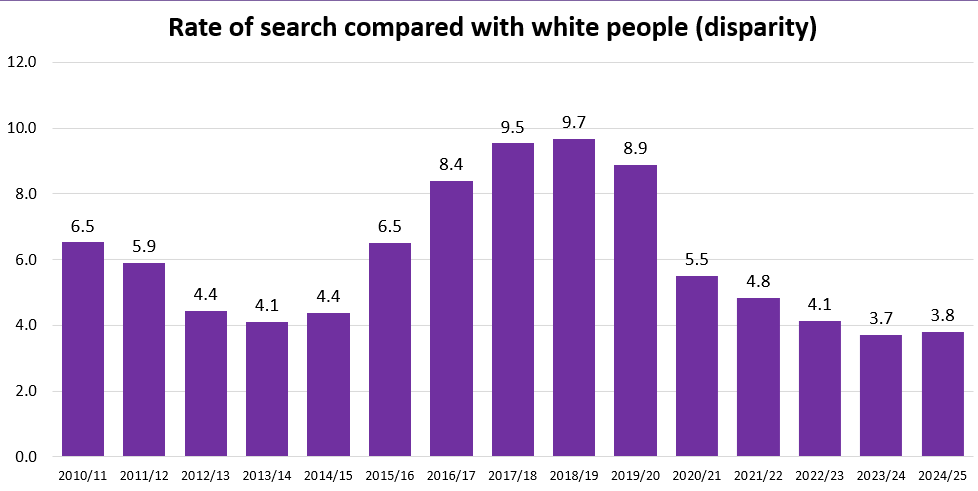
First, the numbers are correct. This Home Office chart is for Black:White disproportionality in E&W.
But note the 'cliff edge' after 2019/20. That is caused by switching from the 2011 to 2021 Census data: the population got quite rapidly more diverse over that decade.
So part of the rise and then fall in disproportionality is a function of the denominator becoming increasingly out of date. I did a thread on this issue last year.
The second issue is that because a majority of Black people in E&W live in London, the number of Black people stopped and searched by the Met drives national disproportionality calculations (even if dispro doesn't change in London). gov.uk/government/pub…
So, turning to the Met, if you look at the bottom R chart here, you'll see the number of Black people stopped and searched by the Met rose after 2017/18 to a peak in 2019/20. (Source: Home Office S&S ethnic disparity time series ). gov.uk/government/sta…
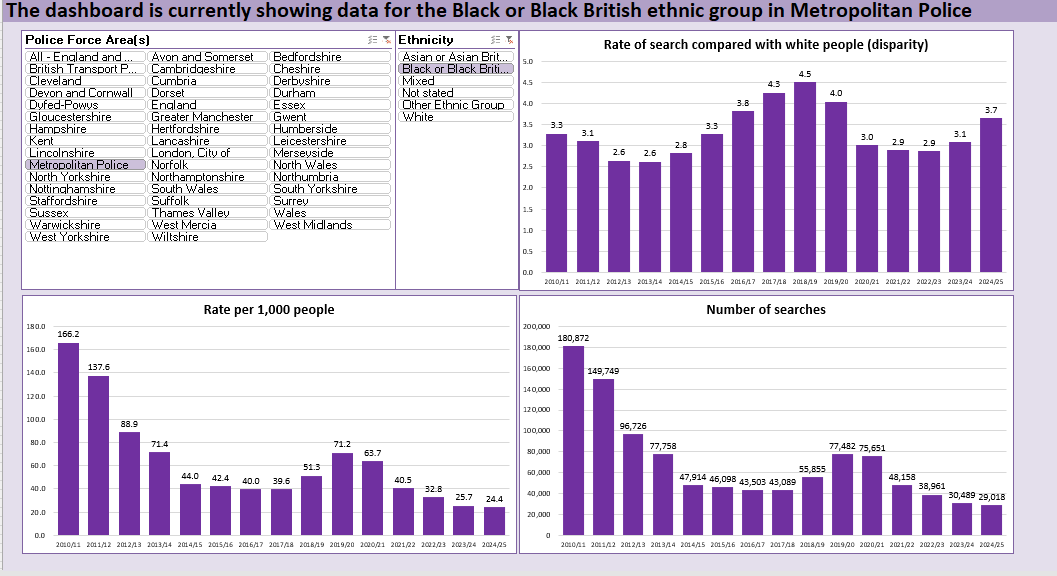
Why did the number of stops of Black (and White and Asian) people rise during those years? Mainly as a response to a surge in knife crime and especially knife homicides (which have since fallen right back).
So, is this progress towards race equity in the use of police powers? I would say yes and no. Yes, because calculated disproportionality has fallen. No, because key drivers of that have almost certainly been using updated Census data and changes to knife violence (esp in London).
Though it is worth saying that knife violence - and especially knife homicide - is another place where disproportionality is seen, and reducing those crime types will have reduced disproportionality in victimisation (and offending).
I've been wondering recently how many racist police officers were racist when they joined, and whether part of the issue is logical fallacies arising from having a lot of contact with very narrow sections of society in places they may not otherwise be familiar with.
Does this analogy work? Imagine you run a car repair garage and for whatever reason most of your customers drive BMWs, and they only bring them to you when they break down. Is there a risk you start thinking there's something wrong with BMWs in particular?
Something I've been reflecting on recently: I worry that an emphasis on places (e.g. hotspot policing) over people (those causing the greatest harm) may be a driver of disproportionality and especially 'false positive' contact between policing and the public.
Linked to this, I worry that policing generally does not adequately clarify the *number of people they believe are causing the greatest harms* in particular locations.
Lots of possible examples, but take robbery: hypothetically, you might have 100 robberies in an area (a 'robbery hotspot') over a period of time, each with one suspect. You have named suspects for only 15, consisting of 10 people. For the other 85 only approx age, sex, ethnicity.
On Sunday, the Guardian ran an article looking at what has happened to ethnic disparities in the UK 5yrs on from George Floyd. It includes this chart on Stop and Search (which relates to Eng+Wal). What it misses is the impact of switching from the 2011 to 2021 Censuses [cont'd]
Handily, the Home Office publishes an 'ethnic disparities time series dashboard' for stop and search. Here's Greater Manchester Police. Note how in the top R chart black/white disparity increases to a cliff edge after 2019/20. #stopsearch assets.publishing.service.gov.uk/media/66f44156…
It looks like racial disparity got worse for a decade before suddenly improving. Was that a police force growing increasingly racist, followed by George Floyd/BLM effect?
I had a look at #schoolexclusions data the other day, and since then received a breakdown with sex and FSM eligibility as well as ethnicity - this time for all state schools (not just secondary) across 4 years.
In this thread I'll present various ways of looking at the data. 🧵
The main question I'll be examining is how rates of exclusion compare between white and black pupils. As a rule, Asian pupils are excluded less often.
In this first chart, we see that boys are permanently excluded more often than girls. Across both sexes black Caribbean children are exluded more often than white British, followed by black African and children of 'other' white backgrounds.
A thread on the likely interaction of systemic/structural inequalities and institutional racism, looking at #knifecrime involving young people in London. 🧵
1) Police data on knife crime shows clear racial disproportionality in both victimisation and offending (which overlap), with violence concentrated in more deprived neighbourhoods; higher crime areas are typically allocated more police resources.
2) In discussing knife crime, it is common for people to highlight its presence in 'black communities', and to responsibilise 'black communities' or 'the community' to find solutions. (No-one ever talks about white Londoners in those terms.)
The Home Office published their quarterly update of crime outcomes data today, and I've been taking my periodic look at rape charge rates.
Here, first, we see that the charge rate for rapes recorded in 2020/21 has now reached 4.0% and continues to rise. #crimestats
1/ 🧵
I can provide this kind of analysis because I've been collating an archive of the quarterly updates over the last 2 yrs, something I'm not aware anyone else has done.
Here's a summary of the data.
2/
We can look at charge rate progression in chart form, comparing where successive years have got to. The dashed lines and hollow markers indicate no refresh of the data published at that point.