$ZIM : 𝗢𝗻𝗲 𝗼𝗳 𝘁𝗵𝗲 𝗠𝗼𝘀𝘁 𝗠𝗶𝘀𝗽𝗿𝗶𝗰𝗲𝗱 𝗖𝗼𝗺𝗽𝗮𝗻𝗶𝗲𝘀 𝗶𝗻 𝘁𝗵𝗲 𝗠𝗮𝗿𝗸𝗲𝘁
𝗠𝗮𝗿𝗸𝗲𝘁 𝗖𝗮𝗽: ~$3.0B
𝗖𝗮𝘀𝗵 𝗼𝗻 𝗛𝗮𝗻𝗱: ~$2.6B
𝗖𝗮𝘀𝗵 𝗳𝗿𝗼𝗺 𝗢𝗽𝗲𝗿𝗮𝘁𝗶𝗼𝗻𝘀 𝘁𝗼 𝗗𝗮𝘁𝗲: ~$600M
𝗘𝗻𝘁𝗲𝗿𝗽𝗿𝗶𝘀𝗲 𝗩𝗮𝗹𝘂𝗲: -$200M (𝗡𝗲𝗴𝗮𝘁𝗶𝘃𝗲)
With the $ZIM buyout now practically dead due to government opposition, a great opportunity has emerged from the ashes.
The market is effectively valuing one of the world’s youngest and most efficient container fleets, a leading Trans-Pacific carrier, and billions of dollars of earnings potential at a negative $200 million enterprise value. Insane.
$HLAG and $MAERSK recently updated their outlooks, the positive news sent both stocks up around 7%. We believe $ZIM should benefit even more, as it has one of the highest sensitivities to spot freight rates. We expect the company to report strong results soon.
𝗙𝗿𝗲𝗶𝗴𝗵𝘁 𝗥𝗮𝘁𝗲𝘀
Based on current freight rates, we estimate $ZIM is currently earning approximately $0.7 to $0.8 per share every week.
Peak season is only beginning. Traditionally it starts in July and August ahead of the Christmas shopping season. This year, however, demand strengthened unusually early, with peak conditions beginning as early as May due to a shortage of available vessels.
𝗪𝗵𝘆 𝘁𝗵𝗲 𝗦𝗵𝗶𝗽𝗽𝗶𝗻𝗴 𝗠𝗮𝗿𝗸𝗲𝘁 𝗥𝗲𝗺𝗮𝗶𝗻𝘀 𝗧𝗶𝗴𝗵𝘁
For years analysts have predicted oversupply. They continue to ignore that effective capacity, not theoretical capacity, determines freight rates.
𝟭. 𝗦𝘂𝗲𝘇 𝗖𝗮𝗻𝗮𝗹 𝗗𝗶𝘀𝗿𝘂𝗽𝘁𝗶𝗼𝗻
The Red Sea situation continues forcing many vessels around the Cape of Good Hope, extending voyage times and effectively removing an estimated 8-10% of global container shipping capacity. Longer voyages mean fewer vessels are available for new cargo until normal Suez traffic resumes.
𝟮. 𝗣𝗼𝗿𝘁 𝗖𝗼𝗻𝗴𝗲𝘀𝘁𝗶𝗼𝗻
Ports around the world remain congested while very few major new ports are being built. Every additional day ships spend waiting effectively removes capacity from the global fleet, further tightening vessel availability.
𝟯. 𝗦𝘁𝗿𝗼𝗻𝗴 𝗚𝗹𝗼𝗯𝗮𝗹 𝗧𝗿𝗮𝗱𝗲
Global trade continues growing faster than expected.
2024: ~7%
2025: ~4.8%
2026: We expect ~5%
Demand continues surprising to the upside.
The result is simple.
Analysts correctly predicted that the number of ships would increase. What they missed is that effective capacity continues shrinking because of longer voyages, port congestion and stronger-than-expected global trade. As a result, charter rates remain near multi-year highs despite fleet growth.
𝗠𝗮𝗿𝗸𝗲𝘁 𝗖𝗮𝗽: ~$3.0B
𝗖𝗮𝘀𝗵 𝗼𝗻 𝗛𝗮𝗻𝗱: ~$2.6B
𝗖𝗮𝘀𝗵 𝗳𝗿𝗼𝗺 𝗢𝗽𝗲𝗿𝗮𝘁𝗶𝗼𝗻𝘀 𝘁𝗼 𝗗𝗮𝘁𝗲: ~$600M
𝗘𝗻𝘁𝗲𝗿𝗽𝗿𝗶𝘀𝗲 𝗩𝗮𝗹𝘂𝗲: -$200M (𝗡𝗲𝗴𝗮𝘁𝗶𝘃𝗲)
With the $ZIM buyout now practically dead due to government opposition, a great opportunity has emerged from the ashes.
The market is effectively valuing one of the world’s youngest and most efficient container fleets, a leading Trans-Pacific carrier, and billions of dollars of earnings potential at a negative $200 million enterprise value. Insane.
$HLAG and $MAERSK recently updated their outlooks, the positive news sent both stocks up around 7%. We believe $ZIM should benefit even more, as it has one of the highest sensitivities to spot freight rates. We expect the company to report strong results soon.
𝗙𝗿𝗲𝗶𝗴𝗵𝘁 𝗥𝗮𝘁𝗲𝘀
Based on current freight rates, we estimate $ZIM is currently earning approximately $0.7 to $0.8 per share every week.
Peak season is only beginning. Traditionally it starts in July and August ahead of the Christmas shopping season. This year, however, demand strengthened unusually early, with peak conditions beginning as early as May due to a shortage of available vessels.
𝗪𝗵𝘆 𝘁𝗵𝗲 𝗦𝗵𝗶𝗽𝗽𝗶𝗻𝗴 𝗠𝗮𝗿𝗸𝗲𝘁 𝗥𝗲𝗺𝗮𝗶𝗻𝘀 𝗧𝗶𝗴𝗵𝘁
For years analysts have predicted oversupply. They continue to ignore that effective capacity, not theoretical capacity, determines freight rates.
𝟭. 𝗦𝘂𝗲𝘇 𝗖𝗮𝗻𝗮𝗹 𝗗𝗶𝘀𝗿𝘂𝗽𝘁𝗶𝗼𝗻
The Red Sea situation continues forcing many vessels around the Cape of Good Hope, extending voyage times and effectively removing an estimated 8-10% of global container shipping capacity. Longer voyages mean fewer vessels are available for new cargo until normal Suez traffic resumes.
𝟮. 𝗣𝗼𝗿𝘁 𝗖𝗼𝗻𝗴𝗲𝘀𝘁𝗶𝗼𝗻
Ports around the world remain congested while very few major new ports are being built. Every additional day ships spend waiting effectively removes capacity from the global fleet, further tightening vessel availability.
𝟯. 𝗦𝘁𝗿𝗼𝗻𝗴 𝗚𝗹𝗼𝗯𝗮𝗹 𝗧𝗿𝗮𝗱𝗲
Global trade continues growing faster than expected.
2024: ~7%
2025: ~4.8%
2026: We expect ~5%
Demand continues surprising to the upside.
The result is simple.
Analysts correctly predicted that the number of ships would increase. What they missed is that effective capacity continues shrinking because of longer voyages, port congestion and stronger-than-expected global trade. As a result, charter rates remain near multi-year highs despite fleet growth.
𝗛𝗔𝗥𝗣𝗘𝗫 𝗖𝗼𝗻𝗳𝗶𝗿𝗺𝘀 𝗢𝘂𝗿 𝗧𝗵𝗲𝘀𝗶𝘀
The HARPEX (Harper Petersen Charter Rates Index) tracks worldwide container ship charter rates and is one of the best real-time indicators of supply and demand in the container shipping market.
While many analysts continue predicting oversupply, the HARPEX has continued making new multi-year highs. (See chart below.)
If the market truly had excess vessel capacity, charter rates would be falling, not rising.
Instead, charter rates continue moving higher because effective capacity remains constrained, exactly as our thesis suggests.
Starting in September 2023, $ZIM ordered 48 newbuild container vessels, approximately 80% of which are LNG-powered, with deliveries taking place from June 2026 through December 2028.
At the time, we were not fans of these agreements, believing the company was committing too much capital instead of returning more cash to shareholders. However, the sharp rise in the Harpex Index has completely changed the economics of the deals.
Based on our estimates, the total value of these lease commitments is approximately $4.5 billion. Using current charter market rates, we estimate those contracts are now worth roughly $1.5 billion more than when they were signed.
Based on current short-term charter rates, we estimate these vessels could command roughly double ZIM’s contracted rates if leased today. Even under long-term charter agreements, we estimate they would earn a 30% to 40% premium over the contracted rates.
The HARPEX (Harper Petersen Charter Rates Index) tracks worldwide container ship charter rates and is one of the best real-time indicators of supply and demand in the container shipping market.
While many analysts continue predicting oversupply, the HARPEX has continued making new multi-year highs. (See chart below.)
If the market truly had excess vessel capacity, charter rates would be falling, not rising.
Instead, charter rates continue moving higher because effective capacity remains constrained, exactly as our thesis suggests.
Starting in September 2023, $ZIM ordered 48 newbuild container vessels, approximately 80% of which are LNG-powered, with deliveries taking place from June 2026 through December 2028.
At the time, we were not fans of these agreements, believing the company was committing too much capital instead of returning more cash to shareholders. However, the sharp rise in the Harpex Index has completely changed the economics of the deals.
Based on our estimates, the total value of these lease commitments is approximately $4.5 billion. Using current charter market rates, we estimate those contracts are now worth roughly $1.5 billion more than when they were signed.
Based on current short-term charter rates, we estimate these vessels could command roughly double ZIM’s contracted rates if leased today. Even under long-term charter agreements, we estimate they would earn a 30% to 40% premium over the contracted rates.


$ZIM ’𝘀 𝗙𝗹𝗲𝗲𝘁
$ZIM currently operates approximately 710,000 TEU of vessel capacity and 14 car carriers, which are currently printing money, while continuing to modernize one of the industry’s youngest fleets.
Today, $ZIM operates approximately 35% of the world’s modern LNG-powered container ships despite representing only 1.8% of global container shipping capacity, giving the company one of the industry’s strongest fleet profiles.
When all currently ordered vessels have been delivered, by the end of 2028, $ZIM is expected to operate approximately 920,000 TEU of vessel capacity.
We believe management will ultimately optimize the fleet by reducing operated capacity to approximately 600,000 TEU, based on our estimates, these ship sales alone could generate approximately $25–35 per share of additional cash.
$ZIM currently operates approximately 710,000 TEU of vessel capacity and 14 car carriers, which are currently printing money, while continuing to modernize one of the industry’s youngest fleets.
Today, $ZIM operates approximately 35% of the world’s modern LNG-powered container ships despite representing only 1.8% of global container shipping capacity, giving the company one of the industry’s strongest fleet profiles.
When all currently ordered vessels have been delivered, by the end of 2028, $ZIM is expected to operate approximately 920,000 TEU of vessel capacity.
We believe management will ultimately optimize the fleet by reducing operated capacity to approximately 600,000 TEU, based on our estimates, these ship sales alone could generate approximately $25–35 per share of additional cash.
𝗪𝗵𝘆 $HLAG Wants $ZIM
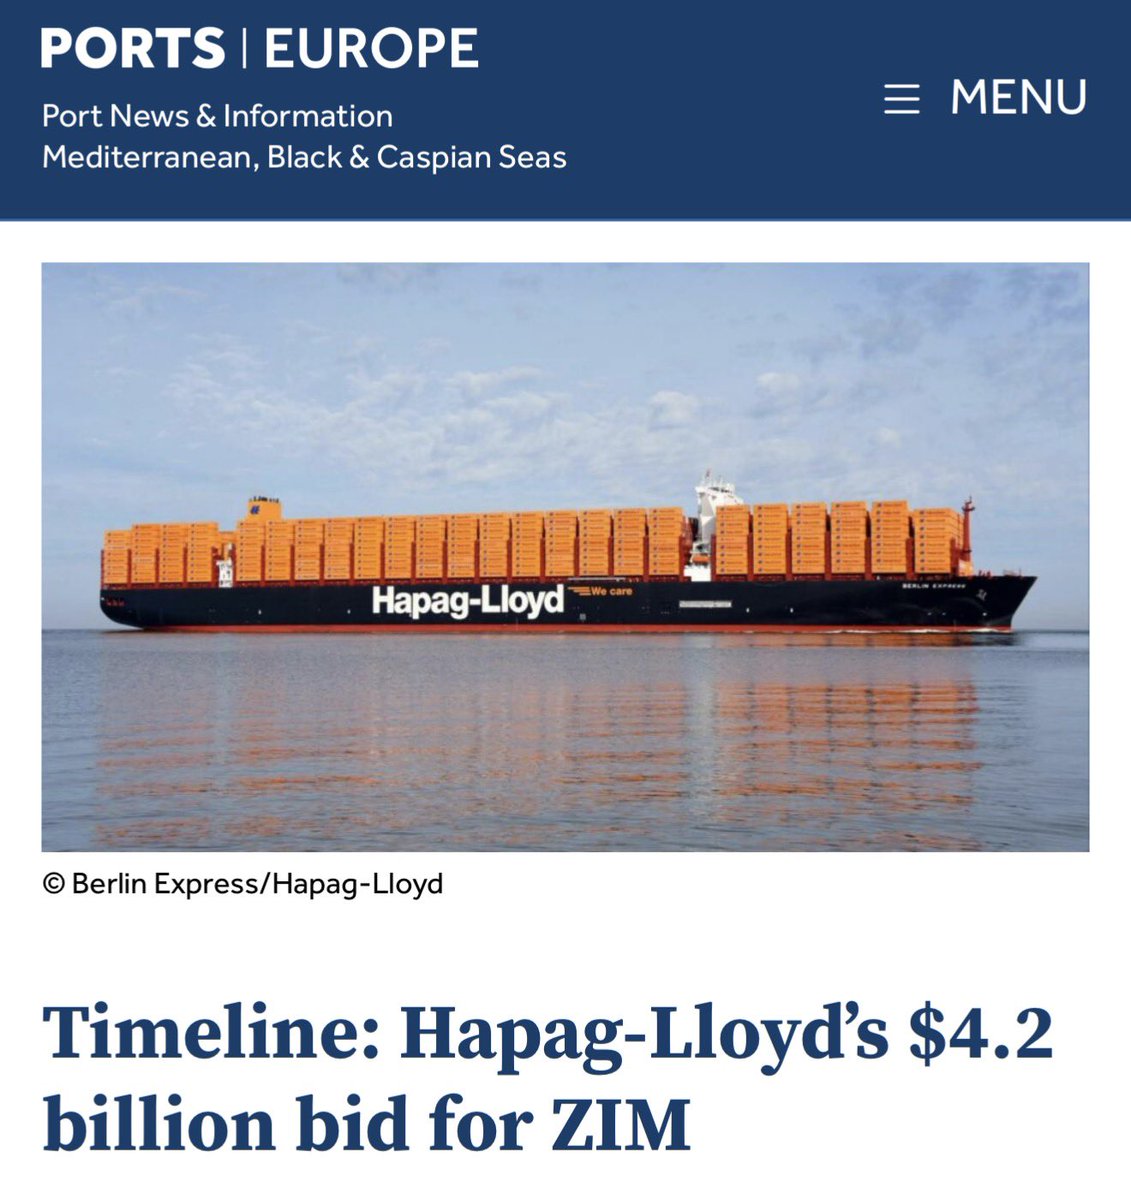
$HLAG agreed to acquire $ZIM for approximately $4.2 billion.
Adding payments to FIMI, approximately $1 billion of vessel-related commitments, employee retention packages estimated at approximately $500 million, and other integration costs, we estimate $HLAG’s total economic commitment approached $5.5-6.0 billion.
The strategic rationale is obvious.
• One of the youngest LNG fleets in the industry.
• Strong Trans-Pacific franchise.
• Immediate operating synergies.
• Significant earnings contribution.
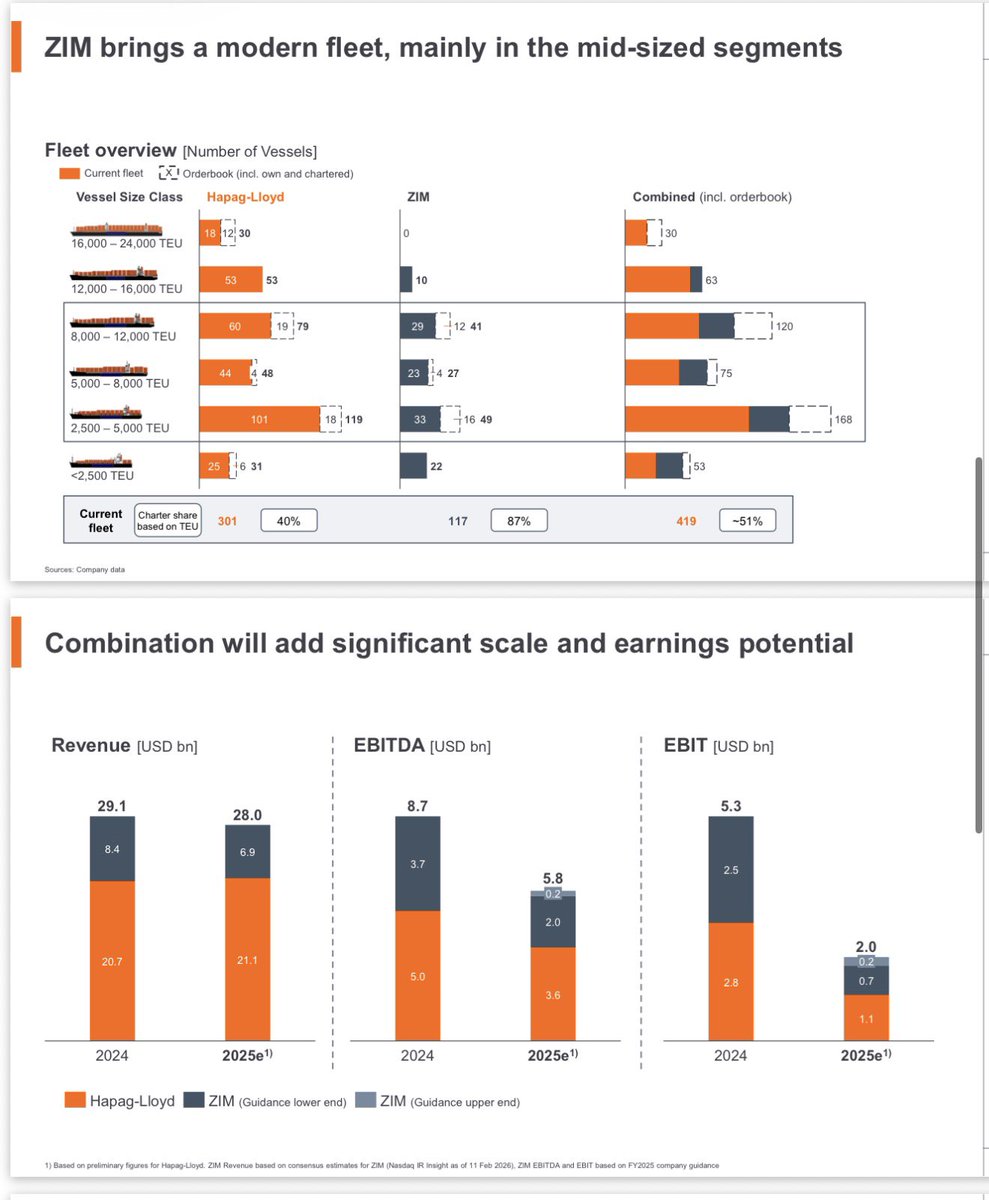
According to $HLAG’s merger presentation(see below), approximately 35% of combined EBIT would come from $ZIM.
If $HLAG has a market capitalization of approximately $26 billion, and $ZIM contributes approximately 38% of combined EBIT, we believe $ZIM could justify a valuation exceeding $10 billion under comparable valuation multiples.
In addition, $HLAG’s own new LNG vessels are not expected to arrive in meaningful numbers until approximately 2029-2033, making $ZIM’s modern fleet strategically valuable today.
In our view, $HLAG was willing to go through all the buyout headaches because it understood that $ZIM’s value is at least double the approximately $6 billion it would have paid.
$HLAG agreed to acquire $ZIM for approximately $4.2 billion.
Adding payments to FIMI, approximately $1 billion of vessel-related commitments, employee retention packages estimated at approximately $500 million, and other integration costs, we estimate $HLAG’s total economic commitment approached $5.5-6.0 billion.
The strategic rationale is obvious.
• One of the youngest LNG fleets in the industry.
• Strong Trans-Pacific franchise.
• Immediate operating synergies.
• Significant earnings contribution.
According to $HLAG’s merger presentation(see below), approximately 35% of combined EBIT would come from $ZIM.
If $HLAG has a market capitalization of approximately $26 billion, and $ZIM contributes approximately 38% of combined EBIT, we believe $ZIM could justify a valuation exceeding $10 billion under comparable valuation multiples.
In addition, $HLAG’s own new LNG vessels are not expected to arrive in meaningful numbers until approximately 2029-2033, making $ZIM’s modern fleet strategically valuable today.
In our view, $HLAG was willing to go through all the buyout headaches because it understood that $ZIM’s value is at least double the approximately $6 billion it would have paid.

𝗛𝗶𝗱𝗱𝗲𝗻 𝗔𝘀𝘀𝗲𝘁𝘀
$ZIM controls approximately 1.08 million containers, of which we estimate approximately 55% are owned and 45% are leased.
The balance sheet carries these assets at approximately $800 million.
Standard containers cost approximately $4,000, while refrigerated containers typically cost approximately $15,000, with specialized units reaching more than $40,000.
Using an estimated average replacement cost of approximately $4,500 per container, the gross replacement value approaches approximately $5 billion.
After adjusting for leased containers, we estimate the economic value of $ZIM’s owned container fleet alone is approximately $3.5-4.0 billion.
𝗖𝗮𝗿 𝗖𝗮𝗿𝗿𝗶𝗲𝗿 𝗕𝘂𝘀𝗶𝗻𝗲𝘀𝘀
$ZIM’s vehicle carrier business is currently operating near peak pricing, generating an estimated $70-80 million per quarter, providing another earnings stream that receives very little attention.
$ZIM controls approximately 1.08 million containers, of which we estimate approximately 55% are owned and 45% are leased.
The balance sheet carries these assets at approximately $800 million.
Standard containers cost approximately $4,000, while refrigerated containers typically cost approximately $15,000, with specialized units reaching more than $40,000.
Using an estimated average replacement cost of approximately $4,500 per container, the gross replacement value approaches approximately $5 billion.
After adjusting for leased containers, we estimate the economic value of $ZIM’s owned container fleet alone is approximately $3.5-4.0 billion.
𝗖𝗮𝗿 𝗖𝗮𝗿𝗿𝗶𝗲𝗿 𝗕𝘂𝘀𝗶𝗻𝗲𝘀𝘀
$ZIM’s vehicle carrier business is currently operating near peak pricing, generating an estimated $70-80 million per quarter, providing another earnings stream that receives very little attention.
𝗘𝗮𝗿𝗻𝗶𝗻𝗴𝘀 𝗘𝘅𝗽𝗲𝗰𝘁𝗮𝘁𝗶𝗼𝗻𝘀
Based on current freight rates, we estimate:
• Q2: $1-2 EPS
• Q3: $6-10 EPS
• Q4: $0-4 EPS
These estimates naturally depend on freight rates remaining near current levels.
𝗗𝗶𝘃𝗶𝗱𝗲𝗻𝗱 𝗘𝘅𝗽𝗲𝗰𝘁𝗮𝘁𝗶𝗼𝗻𝘀
Assuming today’s freight environment continues, we currently expect:
• August 2026: ~$0.30/share
• November 2026: ~$2-3/share
• March 2027: ~$2-3/share
Looking further ahead, we believe $ZIM could also distribute a special dividend of approximately $10-14/share during 2027 or 2028, assuming freight markets remain supportive and management continues executing its capital allocation strategy.
Based on our estimates, that would likely be the highest dividend yield available anywhere in the public equity markets during that period.
We do not expect $ZIM’s share price to skyrocket from current levels. Instead, we believe a modest 15% share price appreciation, combined with dividends, could generate a total return of approximately 100% over the next 24 months.
The majority of shareholder returns, in our view, will come through cash distributions rather than capital appreciation.
Based on our conservative estimates, shareholders could receive approximately 70% of today’s share price back through ordinary and special dividends over the next 24 months, assuming freight markets remain supportive.
Based on our estimates, $ZIM should generate approximately $10 per share in average annual earnings across the shipping cycle, with exceptionally strong years potentially earning more than $22 per share, while weaker years could result in losses of around $2 per share.
The key point is that container shipping is a highly cyclical business. Rather than focusing on any single year, we believe investors should evaluate $ZIM based on its normalized earnings power over a full cycle.
𝗣𝗼𝗿𝘁𝗳𝗼𝗹𝗶𝗼 𝗔𝗹𝗹𝗼𝗰𝗮𝘁𝗶𝗼𝗻 (Updated): 20%
Based on current freight rates, we estimate:
• Q2: $1-2 EPS
• Q3: $6-10 EPS
• Q4: $0-4 EPS
These estimates naturally depend on freight rates remaining near current levels.
𝗗𝗶𝘃𝗶𝗱𝗲𝗻𝗱 𝗘𝘅𝗽𝗲𝗰𝘁𝗮𝘁𝗶𝗼𝗻𝘀
Assuming today’s freight environment continues, we currently expect:
• August 2026: ~$0.30/share
• November 2026: ~$2-3/share
• March 2027: ~$2-3/share
Looking further ahead, we believe $ZIM could also distribute a special dividend of approximately $10-14/share during 2027 or 2028, assuming freight markets remain supportive and management continues executing its capital allocation strategy.
Based on our estimates, that would likely be the highest dividend yield available anywhere in the public equity markets during that period.
We do not expect $ZIM’s share price to skyrocket from current levels. Instead, we believe a modest 15% share price appreciation, combined with dividends, could generate a total return of approximately 100% over the next 24 months.
The majority of shareholder returns, in our view, will come through cash distributions rather than capital appreciation.
Based on our conservative estimates, shareholders could receive approximately 70% of today’s share price back through ordinary and special dividends over the next 24 months, assuming freight markets remain supportive.
Based on our estimates, $ZIM should generate approximately $10 per share in average annual earnings across the shipping cycle, with exceptionally strong years potentially earning more than $22 per share, while weaker years could result in losses of around $2 per share.
The key point is that container shipping is a highly cyclical business. Rather than focusing on any single year, we believe investors should evaluate $ZIM based on its normalized earnings power over a full cycle.
𝗣𝗼𝗿𝘁𝗳𝗼𝗹𝗶𝗼 𝗔𝗹𝗹𝗼𝗰𝗮𝘁𝗶𝗼𝗻 (Updated): 20%

One of the most striking slides in Hapag-Lloyd’s presentation shows that ZIM would have contributed more than 35% of the combined company’s EBIT. Yet today, the market values ZIM at only around one-tenth of Hapag-Lloyd’s market value.
In our view, this disconnect highlights how significantly the market may be undervaluing ZIM’s earnings power and strategic importance.
In our view, this disconnect highlights how significantly the market may be undervaluing ZIM’s earnings power and strategic importance.
• • •
Missing some Tweet in this thread? You can try to
force a refresh