Alexander Agadjanian Profile picture
poli sci phd student @UCBerkeley | political psych + behavior, race, identity, public opinion | past: @MIT, @dartmouth ‘18 | 🇦🇲🇸🇻
Apr 25, 2021 11 tweets 3 min read
The size and organization of CCES cumulative dataset makes it easy to check over time voting trends and drill down to specific demographic subgroups. Posting a #thread here of plots showing some of these interesting trends, spanning vote choice from the 2008 to 2020 elections: Race x gender among all voters: Image
Apr 9, 2021 4 tweets 2 min read
Really interesting study. In addition to important lessons for increasing COVID vaccine acceptance, results are a testament to the wide scope of leaders' ability to influence the public (i.e. it goes beyond just policy attitudes, the typical focus in a lot of elite cues work). Time series polling data on other COVID-related behaviors similarly points to the power of elite cues: .

Echoing a point I made last year: getting out of this pandemic mess might mean counting on the mechanism that exacerbated it washingtonpost.com/outlook/2020/0…
Feb 15, 2021 4 tweets 1 min read
Really valuable and careful work here examining how to ask gender on surveys. Importantly, more inclusive question design/response options does *not* cause noticeable signs of backlash in survey behavior (even though 56% of Americans in 2018 say they oppose nonbinary options). In an experiment, compared to traditional single q on male/female, 2-step q (sex assigned at birth + current gender identity) better captured nonbinary respondents and did not affect 1) question nonresponse, 2) survey breakoff, or 3) views toward the surveyor (i.e. Pew).
Nov 26, 2020 5 tweets 2 min read
Analyses of 2020 polling error often find that error was largest in the most Republican states, but it may not be too informative. The problem is that polling avg's in the most R (& most D) states are worse off in terms of 1) volume of polls behind the avg and 2) quality of polls 
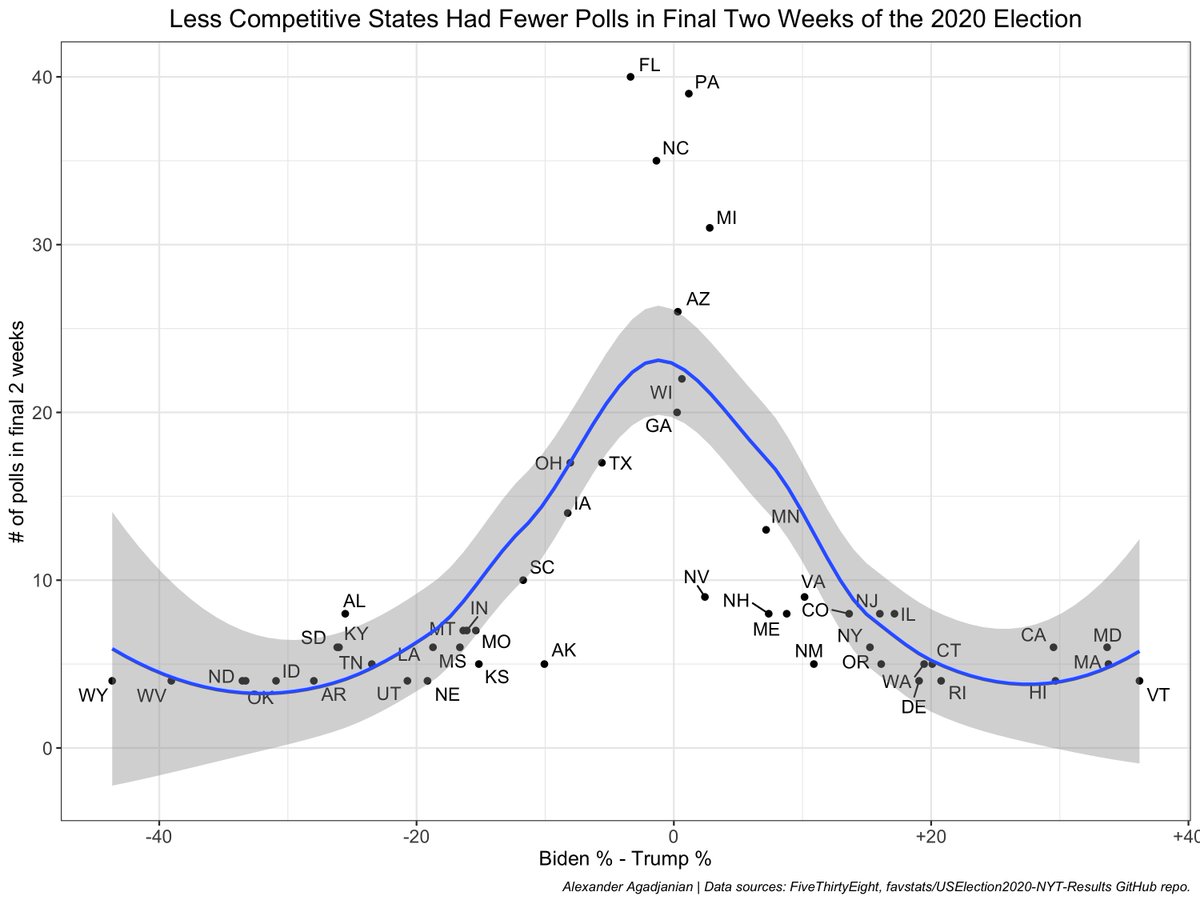
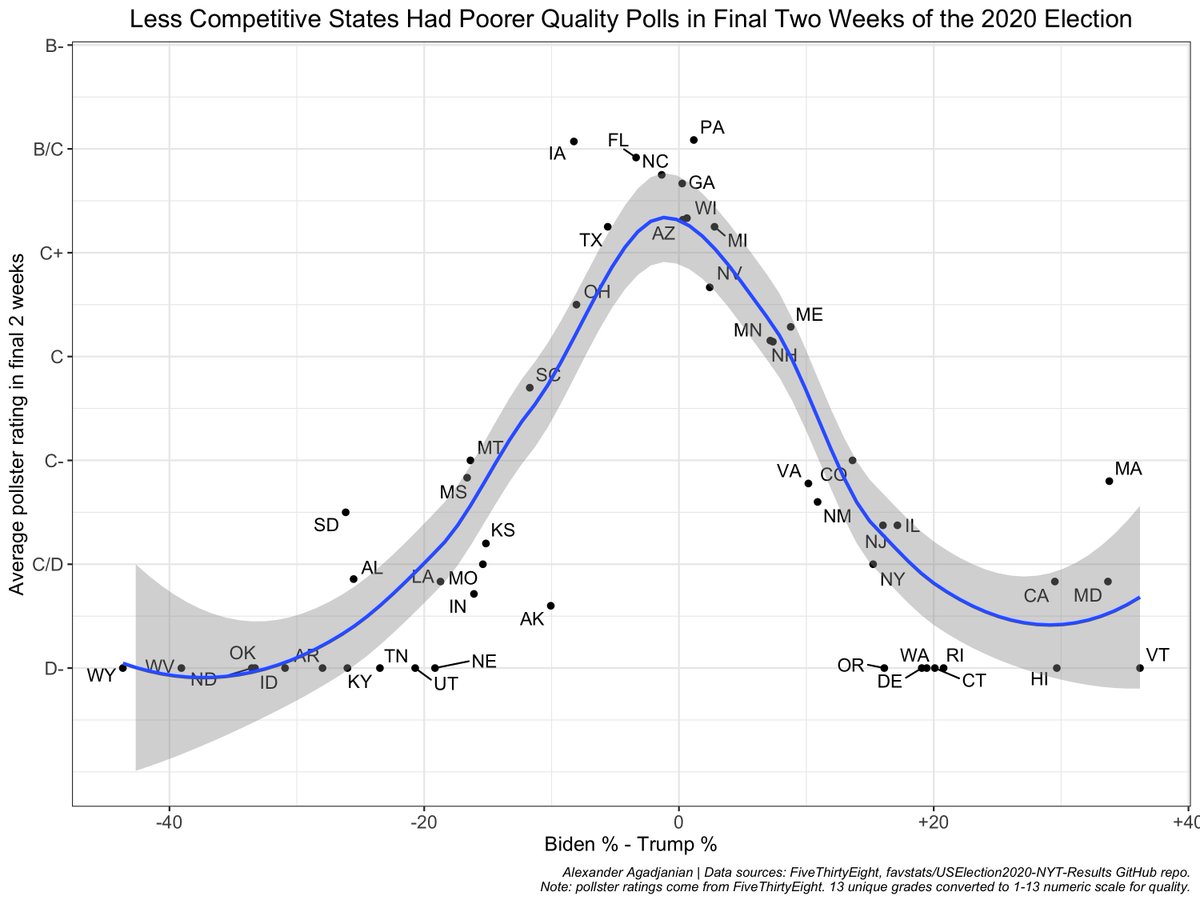
These graphs show that both volume and quality of polls in final 2 weeks is greatest in most competitive states and that it declines as a state gets more red/blue.
Oct 31, 2020 9 tweets 4 min read
There's been a lot of informative work on subgroup voting patterns in 2020. One thing I wonder about: how consistent is the story across surveys? I've been digging into crosstabs to get a sense of within-pollster, 2016-20 changes across 8 pollsters. Threading some results here... A few things:
-why looking within pollster is key dataforprogress.org/blog/5/02/bide…
-crosstab data is here docs.google.com/spreadsheets/d…
-there's a lot of variation in how pollsters report crosstabs
-graphs show diff in Biden's subgroup margin - Clinton's (& legend shows poll's overall shift)
Oct 30, 2020 4 tweets 1 min read
Random thing I've been wondering about lately: based on past elections, should we care about how Independents break? (Are their voting patterns a good indicator of who wins overall?) ANES doesn't always give too large samples of Ind.'s who voted, but overall trend points to yes. Correlation between two-party Democratic president vote shares among pure Independents (from ANES surveys) and among all Americans (election returns) is 0.87.

Same strong correlation holds for Electoral College vote share too.
Sep 30, 2019 10 tweets 5 min read
New from me @UpshotNYT: survey experiment I conducted gauging voter reactions to greater leftist rhetoric + policies coming from Dem candidates this primary season. Progressive turn solidifies Dem support, but there's backlash among Independents. Thread: nytimes.com/2019/09/30/ups… A dominant theme of the first few Democratic debates was the leftward turn taken by candidates on a national stage, and what were the possible implications of this embrace of various progressive policies -- see some example headlines here: