
28, PhD in particle physics. Data Scientist in Finance. Previously worked on ATLAS experiment @CERN
 The weekly case rate per 100k pop is 276.3, down from 321.3 last week.
 The weekly case rate per 100k pop is 300.2, down from 383.1 last week.
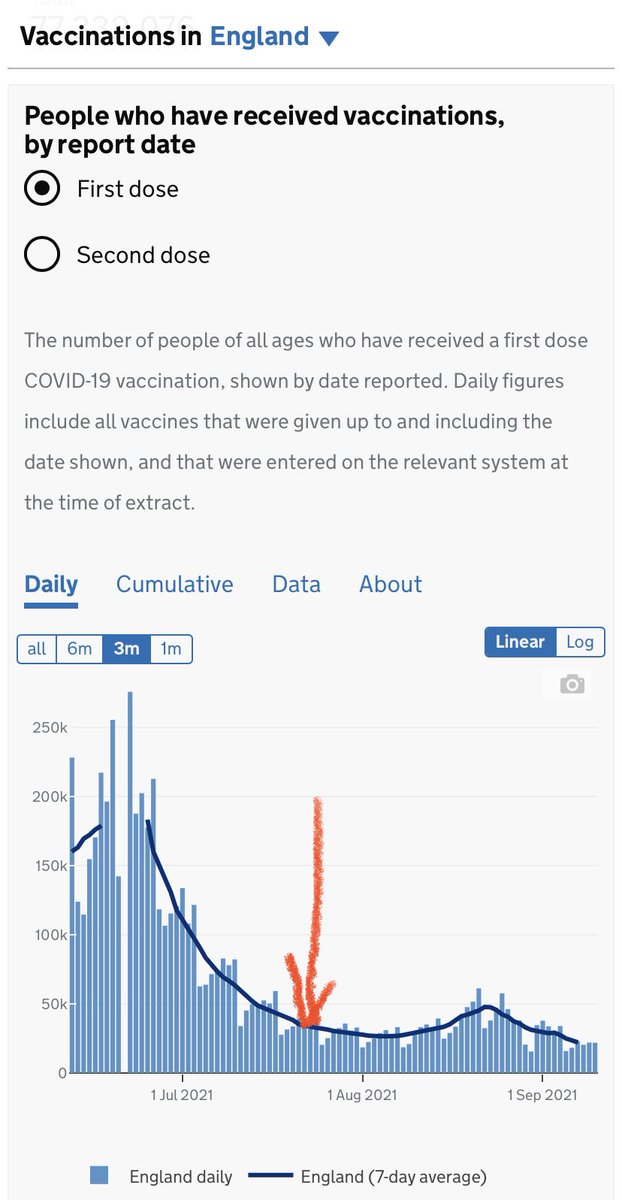
 PCR testing is generally done for people who feel sick, mainly with the three “classic” symptoms (LFT advised two weekly/if you present ‘other’ symptoms)

 The weekly case rate per 100k pop is 380.7, up slightly from 361.8 last week.
 Total weekly cases were seen to grow >3x that of previous week at end of year but weekly growth has now declined & cases are now falling.
 Weekly LFT fraction of +ves, for those areas not affected by small number suppression:
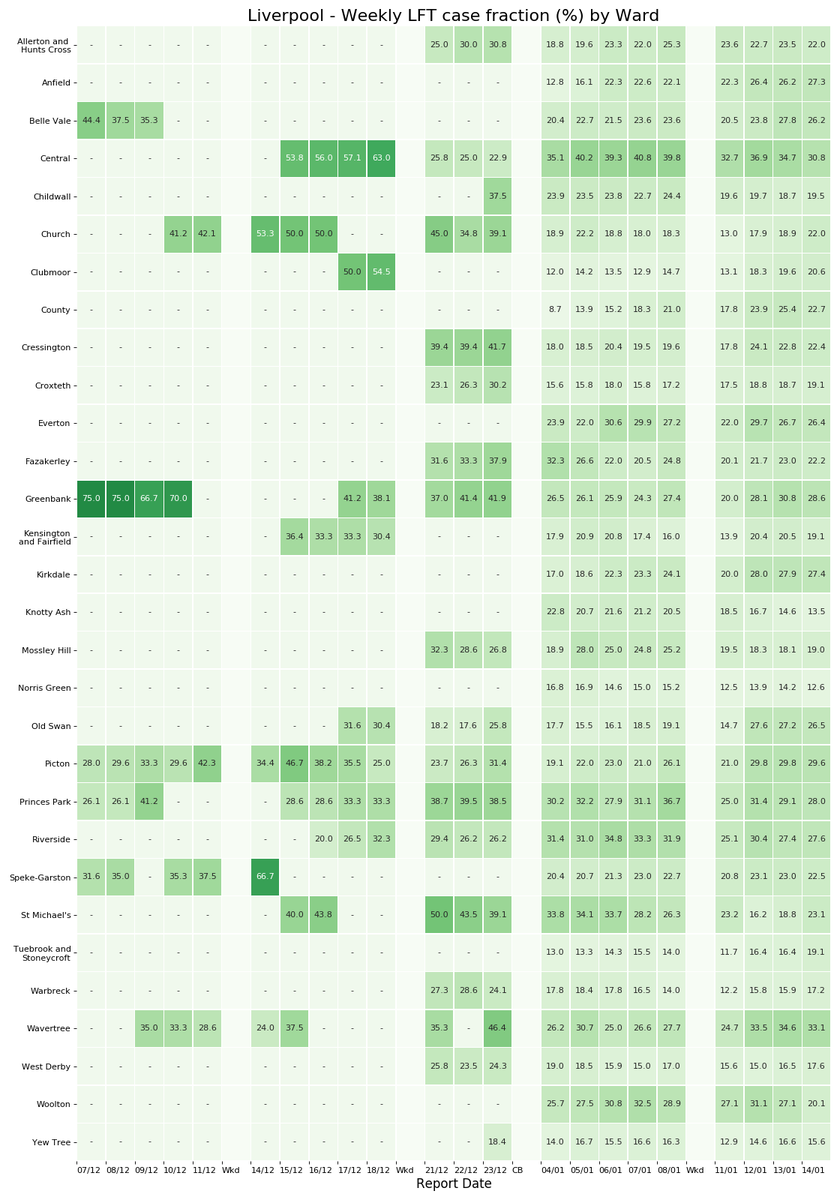
 Weekly LFT fraction of +ves, for those areas not affected by small number suppression:
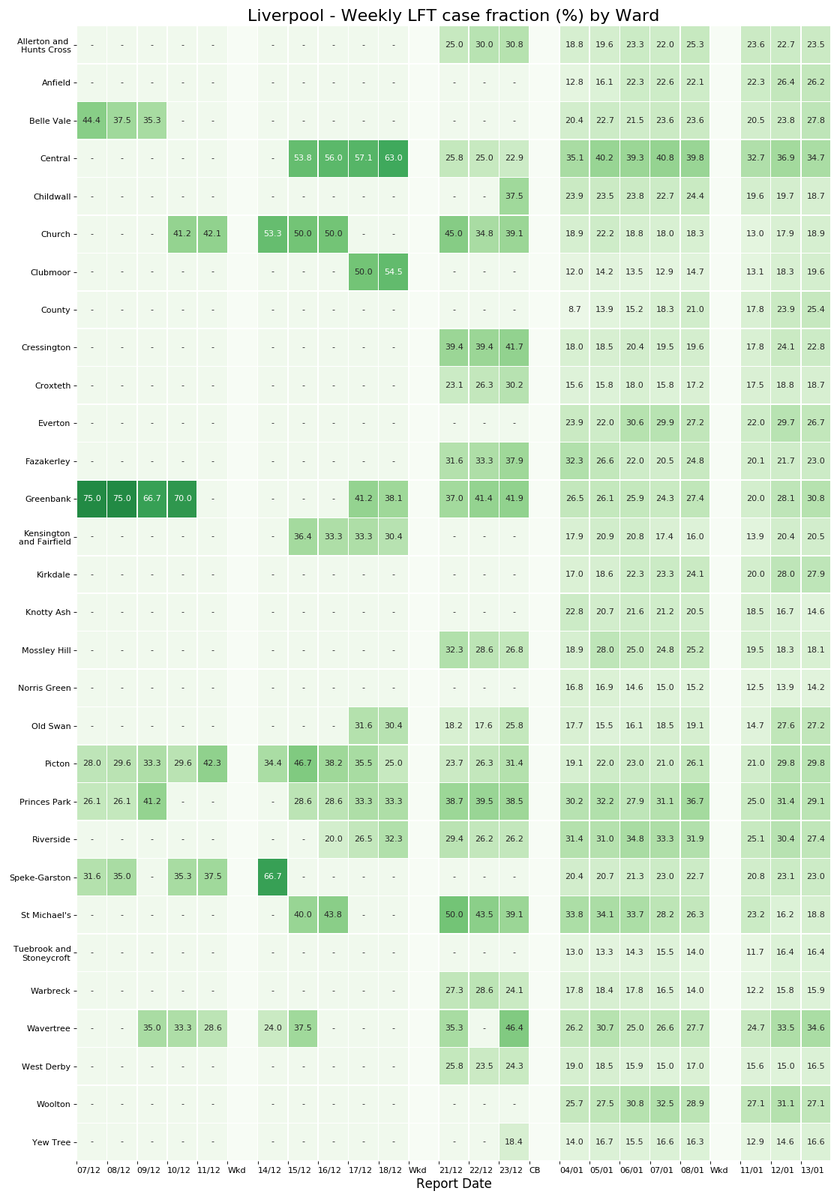
 Weekly LFT fraction of +ves, for those areas not affected by small number suppression:
 Total weekly cases increased at a speed never seen during the 2nd wave, growing > 3x that of previous week.