The Energy Markets & Planning Group at Berkeley Lab conducts technical, economic, and policy analysis of energy topics in the U.S. electricity sector.
 @rtoinsider @CleanEnergyGrid @FERC @ClementsFERC @CleanFERC @ACORE @gregwetstone @TKavulla @EPSAnews @SEIA PJM has the largest queue of any region. Cumulative GW grew 4x from 2017 to 2021 to 288GW. Preliminary numbers show another 40 GW for 2022, making the total in the queue 2x PJM’s highest load. 93% is renewables or storage. See queue data at emp.lbl.gov/node/3133. 2/x
 @POWERmagazine @ELECTRICPOWER @SEPAPower @APowerAlliance @Edison_Electric @publicpowerorg @NRECANews @IPPNYORG @aectnet @BerkeleyLab First, here’s a summary of the top 10 findings on our hybrid research. For the full report see emp.lbl.gov/publications/b…. 2/x

 While solar has high value at low penetrations, value falls as output grows – solar is 19% of generation in CAISO, with major drops in value. Wind has low value at every penetration, but has faced less value decline with market share to date. 2/x

 The biggest change was drastically less demand for electricity, due in part to sectoral and economic changes, but also to greater energy efficiency driven by policies and technology advancement. Instead of rising by 24% it was dead flat. 2/11
 More than 4.5 GW of utility-scale (>5 MW) solar came online in 2019, bringing cumulative capacity to 29 GW. Projects are spread across all 10 regions that we track, though more heavily concentrated in the sunniest regions. Maps and data available at utilityscalesolar.lbl.gov. 2/x
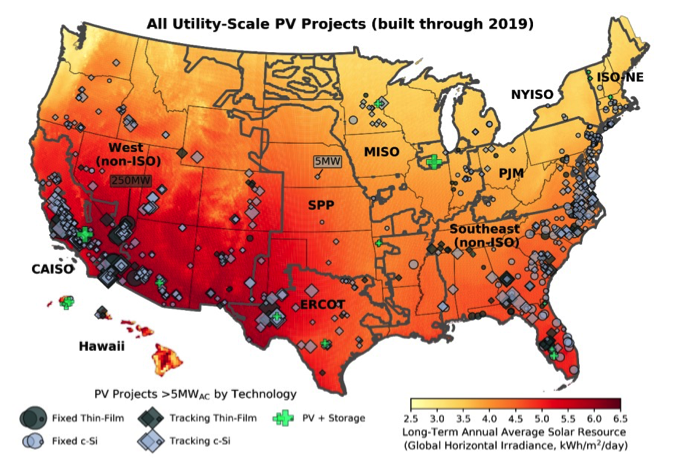
 Many states have programs to help low-income households go solar. But which create the biggest effects? Our research compares LMI incentives, leasing, and PACE finance programs. emp.lbl.gov/publications/i… 2/x
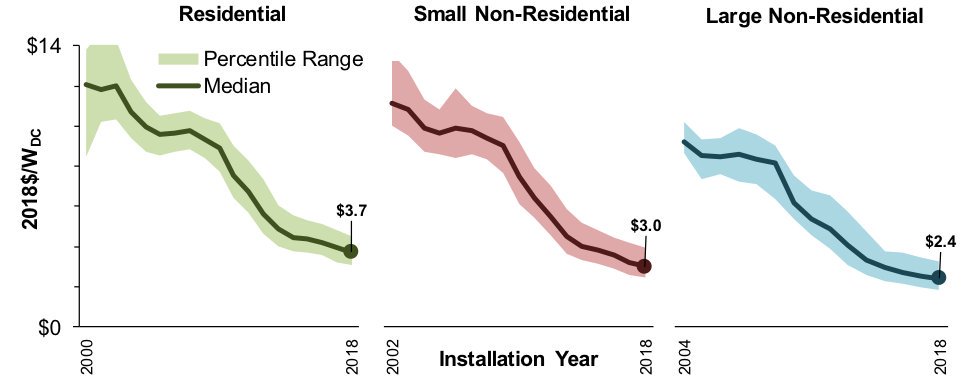
 @BerkeleyLab @BerkeleyLabETA @SEIA @CALSSA_org @CalEnergy @pvmagazineusa @ASES_Solar @SEPAPower @SolarPowerWorld @SolarIndustry Median installed prices for distributed #solar were $3.70/W for residential, $3.00/W for small non-residential, and $2.40/W for large non-residential systems last year, down 5-7% from 2017. 2/x