CA120 Profile picture
A weekly Data and Analysis section for @Capitol_Weekly by @paulmitche11
Nov 5, 2022 9 tweets 4 min read
Looking over some voting data with @rpyers and the new Republican reliance on Election Day Voters is astounding.

With conspiracy theories about VBM the Republican party has sequestered many of their voters to Election Day / In Person voters. 36% of Republicans say they will vote on E-Day and 44% say they will vote in person at a polling place. This is compared to just 9% and 6% respectively for Democrats.

We can see the impact of this just looking at the data from the 11-day vote centers that opened last weekend.
May 30, 2022 4 tweets 2 min read
At this point in the CA Recall election we had 5.4 million votes cast, and by the equivalent of tomorrow, we were at 6.1.

The @Political_Data early vote tracker seems to be struggling to hit the 2 million mark. There are more unreturned ballots three weeks into voting than there were registered voters in total in CA in 2018.
Sep 2, 2020 9 tweets 4 min read
Ok, If I've said it once I've said it a dozen times. Something happens when @surveyusa does a poll in California. I don't even see who they are polling, what the survey is about, I run straight to the crosstabs and exclaim... (with gifs)... This one comes from San Diego where they have historically had some particularly bad polling. For starters, they *randomly call people* and of the 534 that say they are voters, they deem 517 "likely to vote" A 97% rate! Uhm....
Aug 1, 2020 12 tweets 3 min read
If you've been paying attention to the drama around the US Census and apportionment, it is clear that the current administration is playing games - delaying because of COVID made sense, and now they are trying to speed it up again.. but read to the end. There is a surprise! 1/12 Here's the play: Under current law the Census needs to deliver to Congress and the President the apportionment by Dec 31. But, they have asked for a four month delay, which the House has passed, but is sitting in the Senate. This would delay the release until April 31. 2/12
Feb 17, 2020 4 tweets 3 min read
Independent Voters are getting boxed out of their access to the "open" Democratic primary, and it's disproportionately Latinos and younger voters.

A shockingly low 4.5% of Latinos who are independents and got a ballot in the mail have taken the step to get a Dem ballot. 
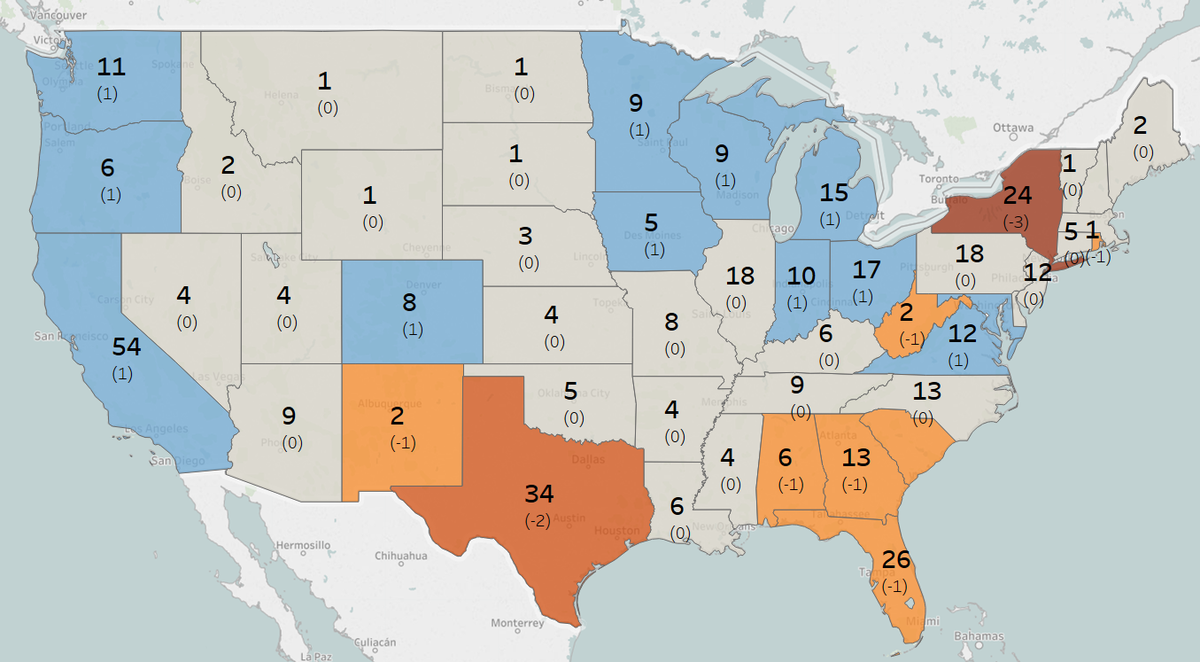
If the presidential campaigns want to win CA, their first, second and third priorities should be to get these folks Dem ballots. All this data is in @Political_Data system! Come on @BernieSanders @MikeBloomberg @PeteButtigieg @ewarren @amyklobuchar @JoeBiden @TomSteyer
Nov 5, 2019 8 tweets 3 min read
Looking for some voter registration growth in the @CASOSvote 150-day report coming out soon? Well, here's all the cities where raw voter registration numbers have skyrocketed by 25% or more. That's cray cray.

Go ahead and tell me DMV / Automatic registration isn't working. 
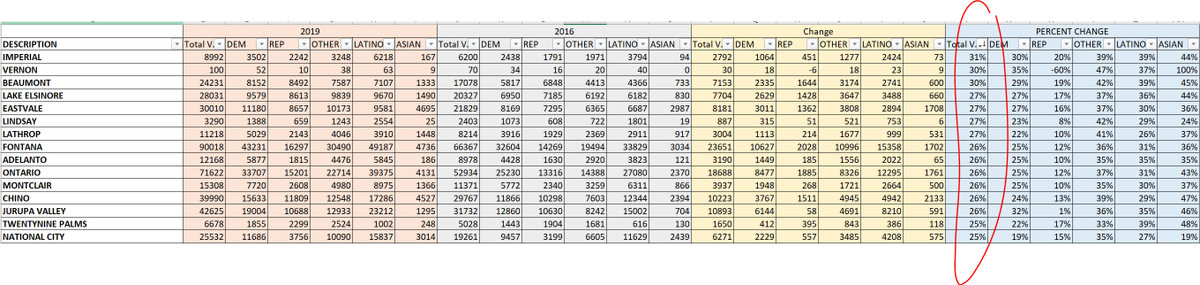
Here are the communities that have more than 1,000 Latinos, and where they have had 30% increase in the number of registered Latino voters.
Nov 5, 2019 9 tweets 3 min read
A lot of people casually throw out there "All the Republicans are re-registering Independent." So we looked. 1/4 With over 40,000 surveys completed in 2016 Primary we can see that there was a good amount of re-registration, and, yes, of the 12,749 Republicans, 300 became Democrats and 830 became Independent/Other. That's a 91.4% retention rate for Republicans, or about 9% switching. 2/4
Oct 30, 2019 10 tweets 5 min read
If you're watching the #CA25 race, here are a couple very real possibilities, with gifs. 1/10 Rumor is the special election will be May 5th or 12th. Either would mean that the primary would be concurrent with the Presidential primary election on March 3. This election would be over 50% Dem because of the Presidential Primary electorate.

But a May Runoff? Ouch. 2/10
Oct 7, 2018 4 tweets 2 min read
Will just start this thread and see where it takes me... This looks at turnout, for CA Statewide elections from 2002 - 2016, broken into three sets [18-24] [25-39] and [everyone else]. Note how 18-24 year-olds turnout has been 37-42 points below everyone else in Gov Generals. 
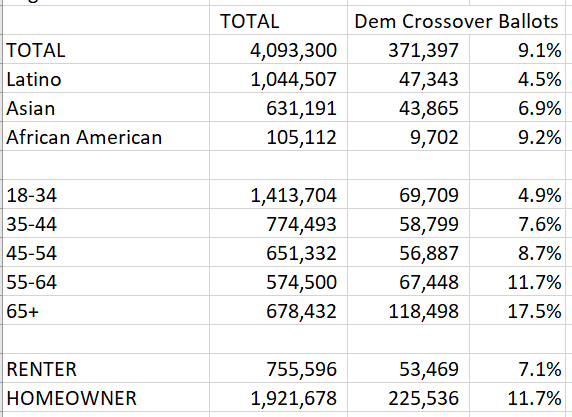
Digging into Latino turnout, we can see in the first chart that Latino Turnout is significantly lower than overall turnout. This is driven by lower turnout by young voters... but, here it gets interesting. The lower turnout for 18-24 is similar between Latino and everyone else.
Jul 28, 2018 4 tweets 2 min read
There are 4.39 million Seniors on the CA Voter File, and an equivalent 4.39 million aged 18-32. So, how do they stack up?

Seniors: 61% turnout in the 18 Primary, comprised 38% of votes cast.

Age 18-32: 17% turnout, comprised 11% of all votes cast. This graphic shows the total number of voters of each age 18-80, with a dot for the number that actually voted in the CA 2018 Primary. You can see two humps in total voters representing Millennial and Boomers, and the way that the turnout increases as voters get older.