 2/ City of #Toronto Healthcare System, 14 days ending Jan 1, 2022.
 City of #Toronto Covid-19 update, Jan 5. ICU occupancy is well below one year ago. CRCI = covid related critical illness.
 Hospitalizations are dramatically lower in C19 cases in vaccinated (breakthrough) vs. unvaccinated. (data expressed as cases per 100,000). But, in younger age groups the actual impact is less than for older.
 City of #Toronto Covid-19 Update, March 17.
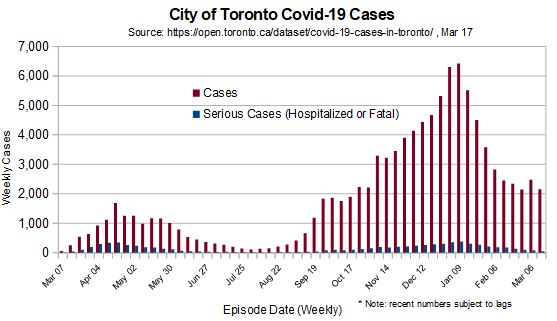
 #Covid19Ontario update March 16. Decline in fatalities tracking wave 1 also.
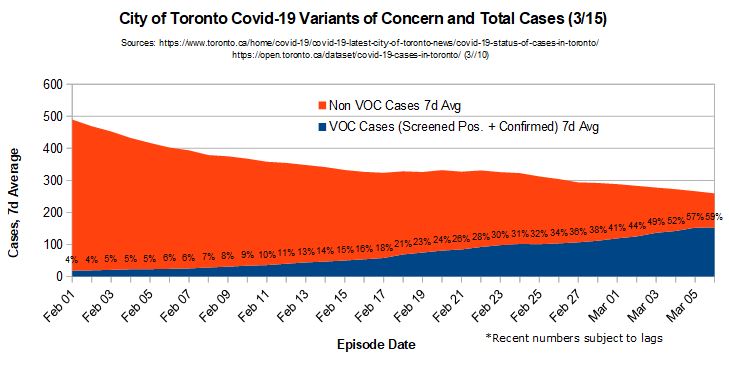 2/ The chart above is the best representation of the status of VOC that I can produce with public data. It comes from Toronto's Covid Status of Cases page. They have a chart showing screened and confirmed voc cases by episode date. I combine this with cases by episode date...
 City of #Toronto Covid-19 Hospitalization Update, March 15.
 2/ The proportion of deaths in Ontario up to August is THE SAME as it usually is. Check out the chart. There was a larger difference between '16-'17 than '19-'20. Does that make any sense?
