Caleb Franzen Profile picture
Founder of Cubic Analytics. Focused on macro, the stock market & Bitcoin. Living around Europe, currently in Albania 📍
Mar 2, 2023 5 tweets 2 min read
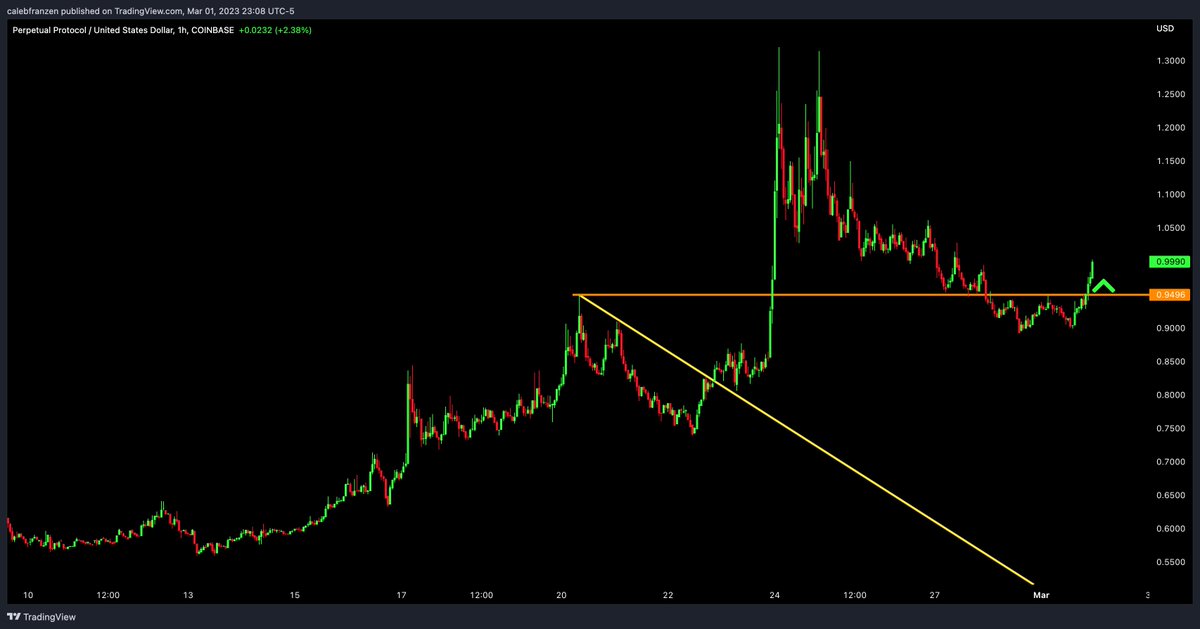
I've been trading $PERP with solid success over the past few weeks:

• Entered 2/17 at $0.7522, sold at $0.81
• Entered 2/23 at $0.8615 & $0.842, sold at $1.2575 & $1.21
• Entered tonight at $0.954, holding.

The break > the orange level triggered a buy signal. Cut below it. Being a bit reflective here, but I've been super "jumpy" in my trades since I started re-engaging with crypto trades in early/mid-January.
Back of the envelope, the trading account (non-BTC) is up +40% YTD. Realistically would have been more than double if I just bought & hold.
Feb 28, 2023 4 tweets 2 min read
We have to stay objective here, fam!

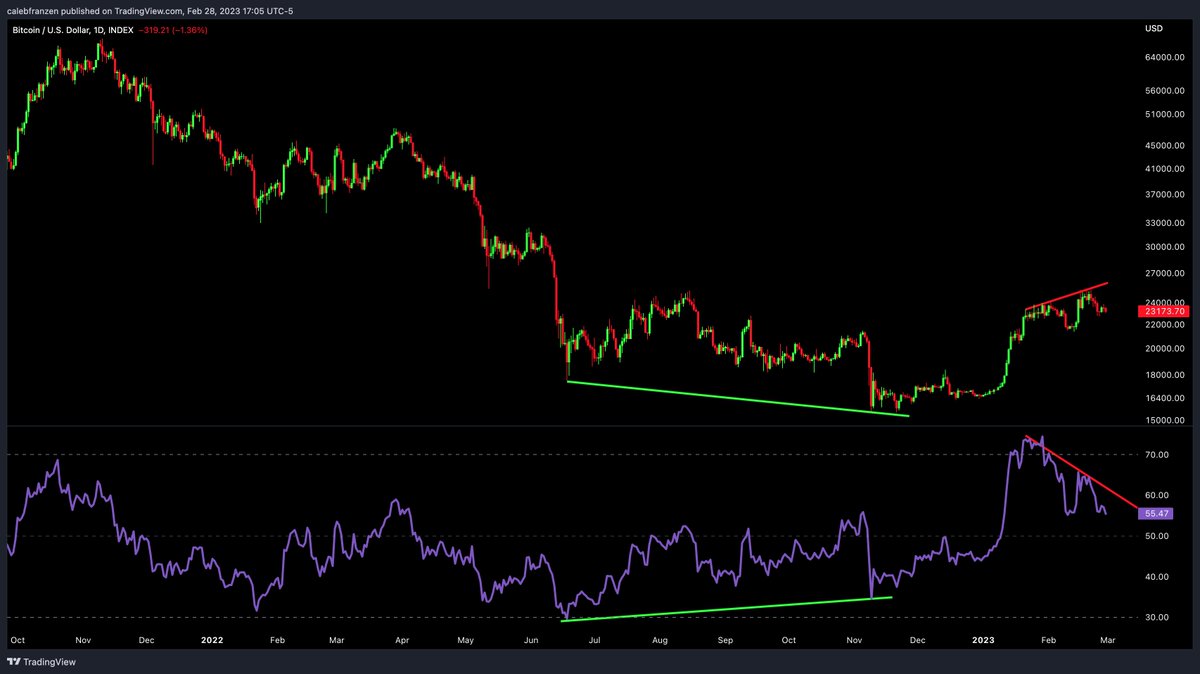
In November 2022 & early January 2023, I highlighted that #Bitcoin was forming a bullish RSI divergence.

Today, it's forming a bearish RSI divergence. Let's see how this plays out.

Stay flexible and recognize the risks, and you'll survive. Here is the first post where I highlighted the bullish divergence:
Feb 28, 2023 4 tweets 2 min read
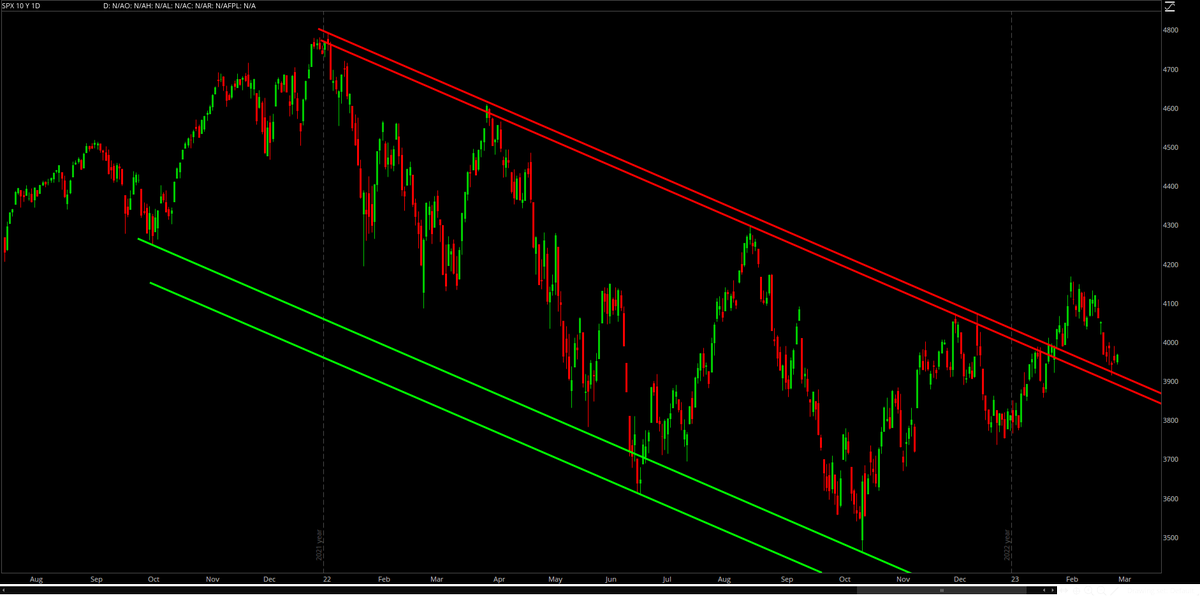
Everyone wanted to focus on the channel when it was potential resistance (including myself), but no one wanted to focus on it as potential support.

Thankfully, we outlined this retest in real-time & even had it as a downside target.

Clean rebound for the S&P 500 $SPX (for now). Calling shots & outlining scenarios before they even happen.

It doesn't get much cleaner than this. Glad I "Babe Ruth'd" this one.
Feb 28, 2023 8 tweets 3 min read
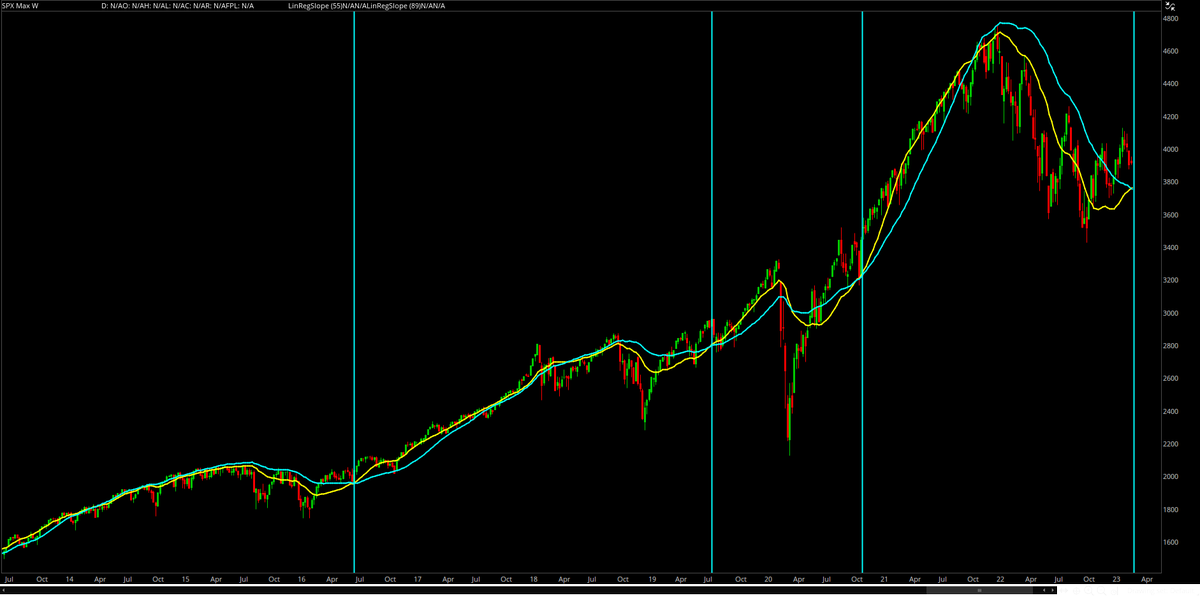
The S&P 500 is flashing one of my favorite bullish signals, for the first time since November 2020.

In fact, this signal has only occurred 4x in the past 10 years!

Here's the signal and why it's important: Linear regressions are a common statistical tool, used in econometrics & finance.
I like to convert linear regressions into slopes and track the "rolling" linear regression. I calculate the trailing regression, then plot the point.

It's basically a moving avg. for regressions.
Feb 27, 2023 7 tweets 3 min read
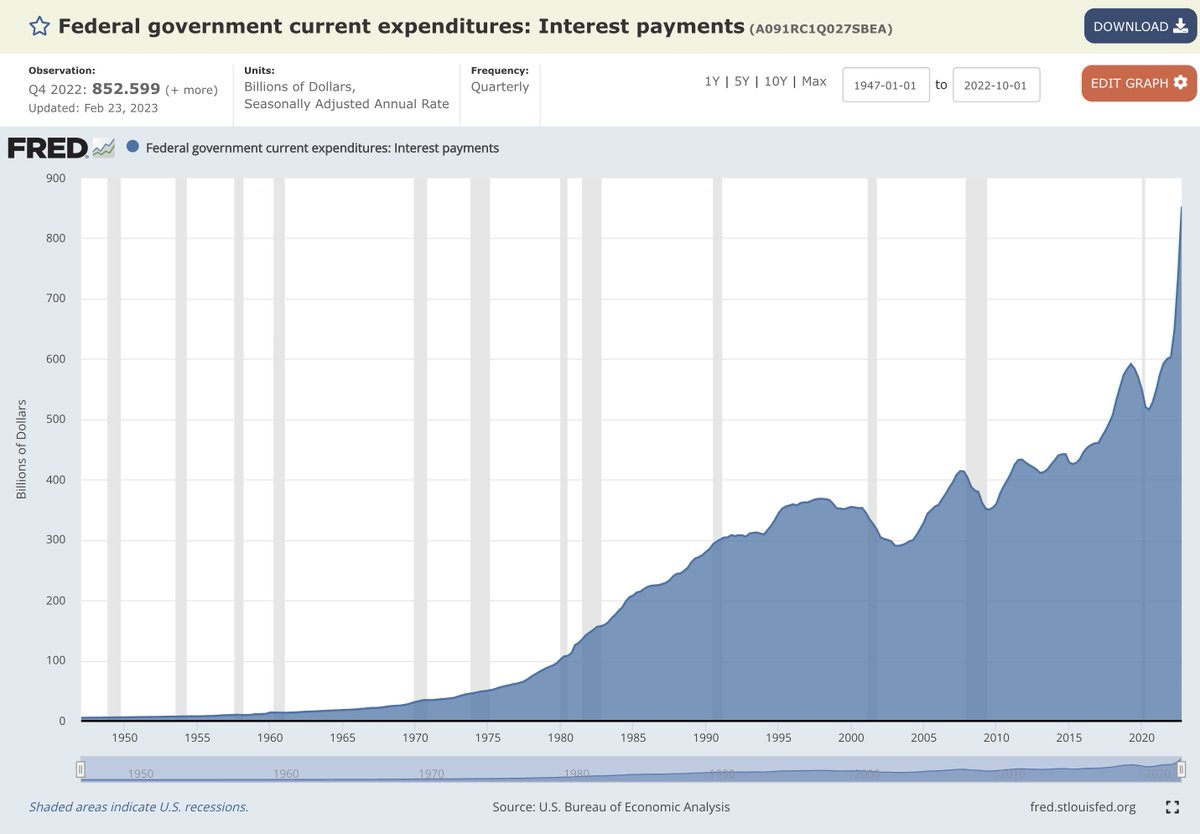
If you've been active on Twitter lately, I'm sure you've seen this chart of federal interest expense.

It's going vertical, which really shouldn't be a surprise. In Q4 2022, federal interest payments were $852.6Bn.

But let's take this a step further... Instead of looking at the nominal value, look at the YoY rate of change! We've never seen interest expense accelerate this fast!
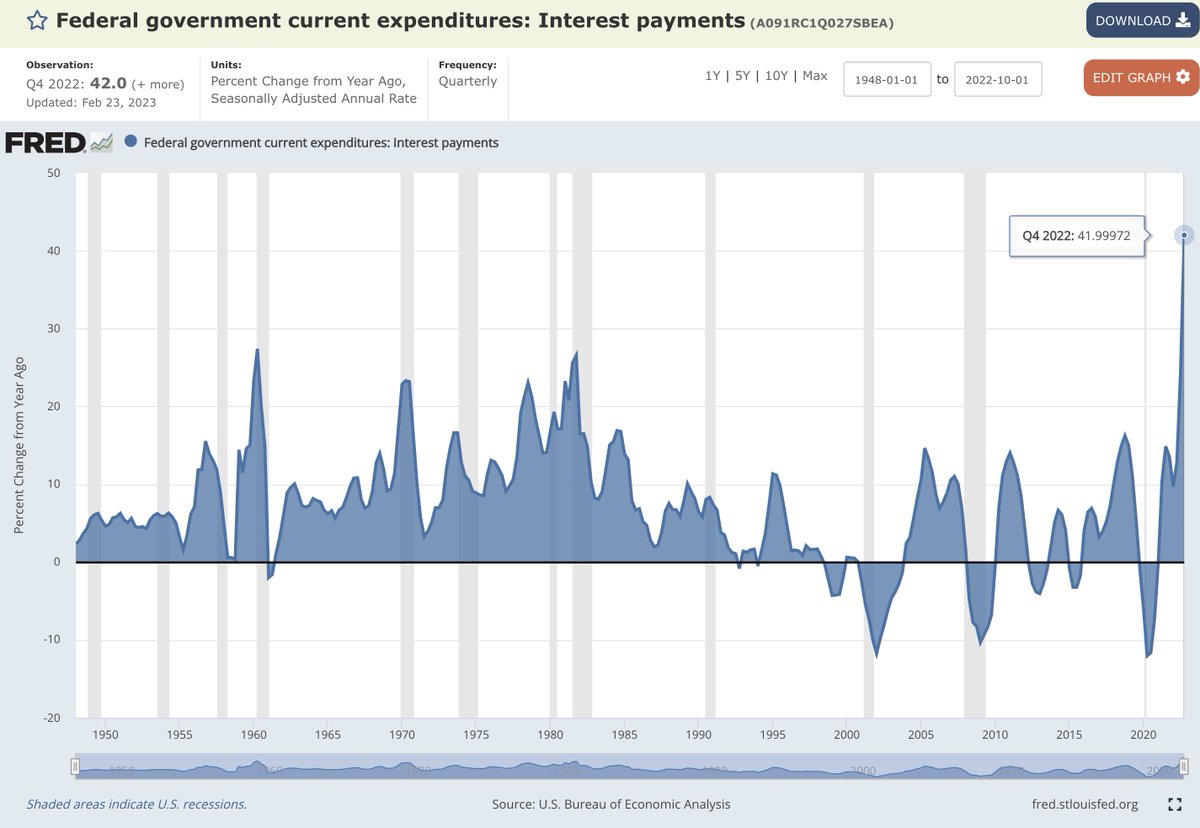
On a YoY basis, interest expense increased by +42%.

Previously, the fastest rate of change was in 1981 at +26.5%.
Feb 25, 2023 28 tweets 7 min read
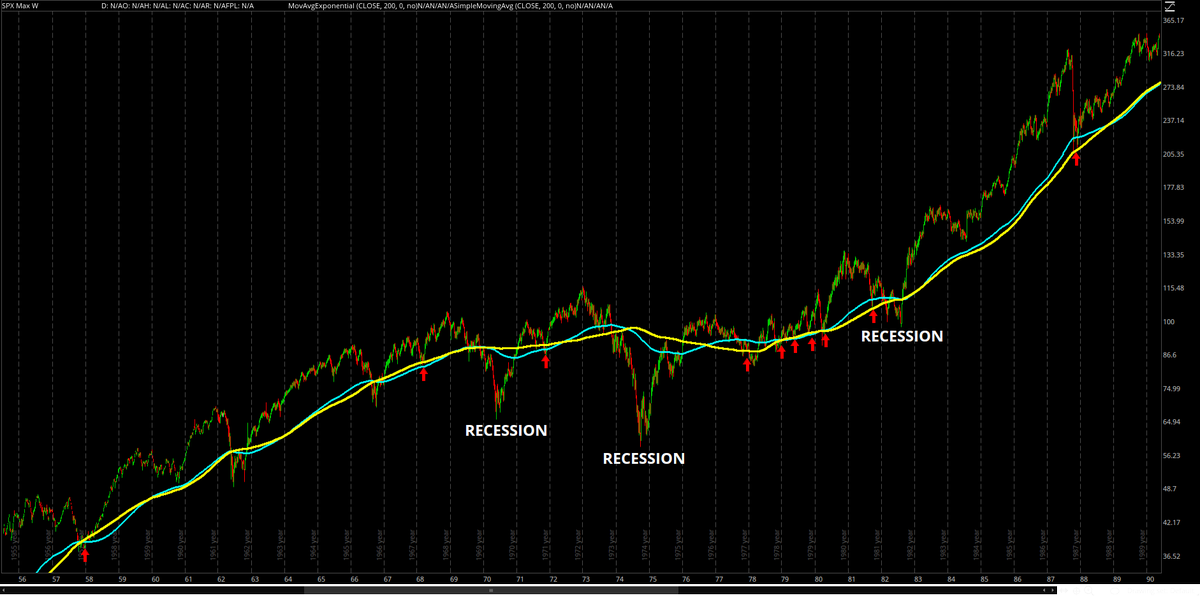
Pro-tip: DCA more aggressively when your favorite assets retest their 200-week moving averages.

Should I do a quick thread on this to show why it's effective? Alright, let's do it. Few things first:

• This is an effective strategy for long-term investors
• I'll share a wide range of effective examples below
• Like all strategies, it doesn't work every time
• In each chart, 200-week EMA is 🔵 & 200 SMA is 🟡
Jan 5, 2023 8 tweets 2 min read
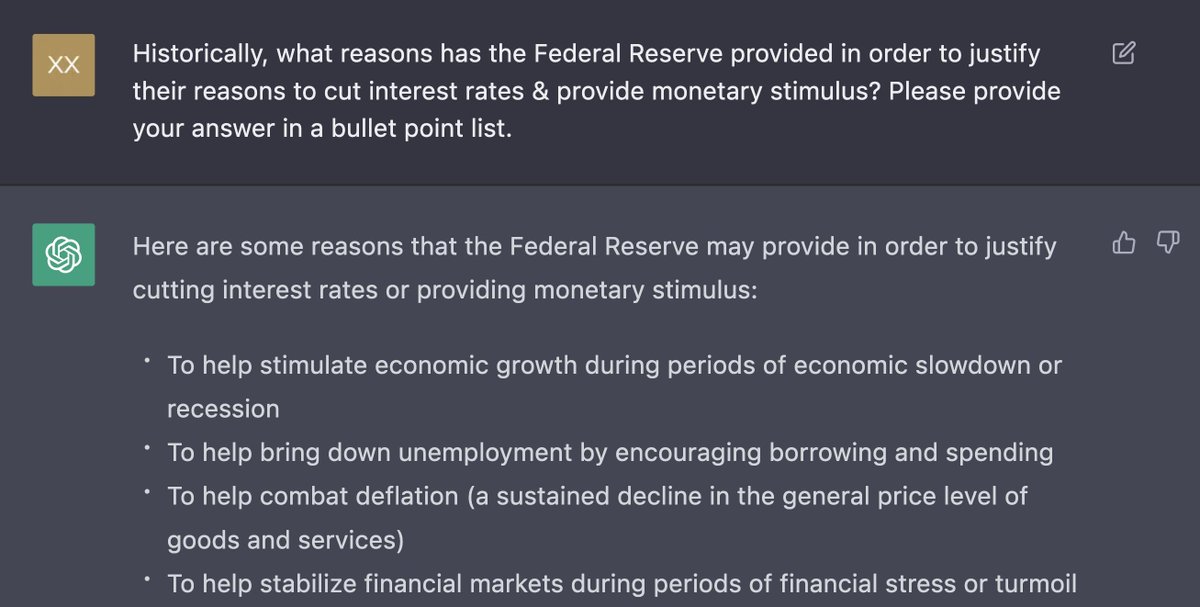
ChatGPT recognizes 4 primary reasons that have caused the Fed to cut interest rates & provide monetary stimulus.

I'll address each of these 4 justifications below: 1. Economic growth was anemic in the first half of 2022, but appears to be coming back in terms of real GDP growth.
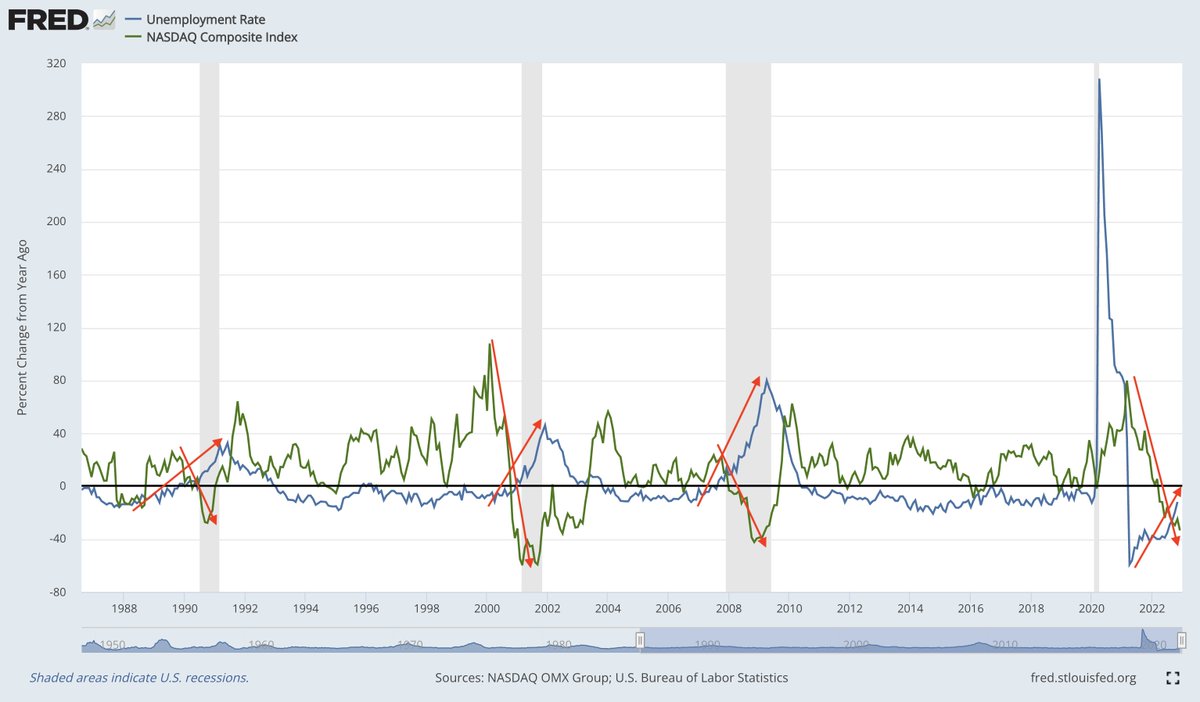
The Atlanta Fed is projecting Q4'22 real GDP growth of +3.8%, higher than Q3's increase of +3.2%.

Economic activity (mfg & svs) is stalling, but GDP is resilient.
Jan 5, 2023 4 tweets 1 min read
Two important labor market updates:
1. Initial unemployment claims was stronger than expected.
2. Private payroll data from ADP was stronger than expected.

After an extremely strong 2022, the labor market is still resilient & extremely dynamic.

The Fed doesn't like that. The Fed is trying to reduce aggregate demand in order to re-equilibrate the market at a lower equilibrium price.

A strong labor market = strong aggregate incomes
Strong aggregate incomes = elevated price pressures

The Fed can't fix supply, so they attack demand.
Dec 16, 2022 10 tweets 21 min read
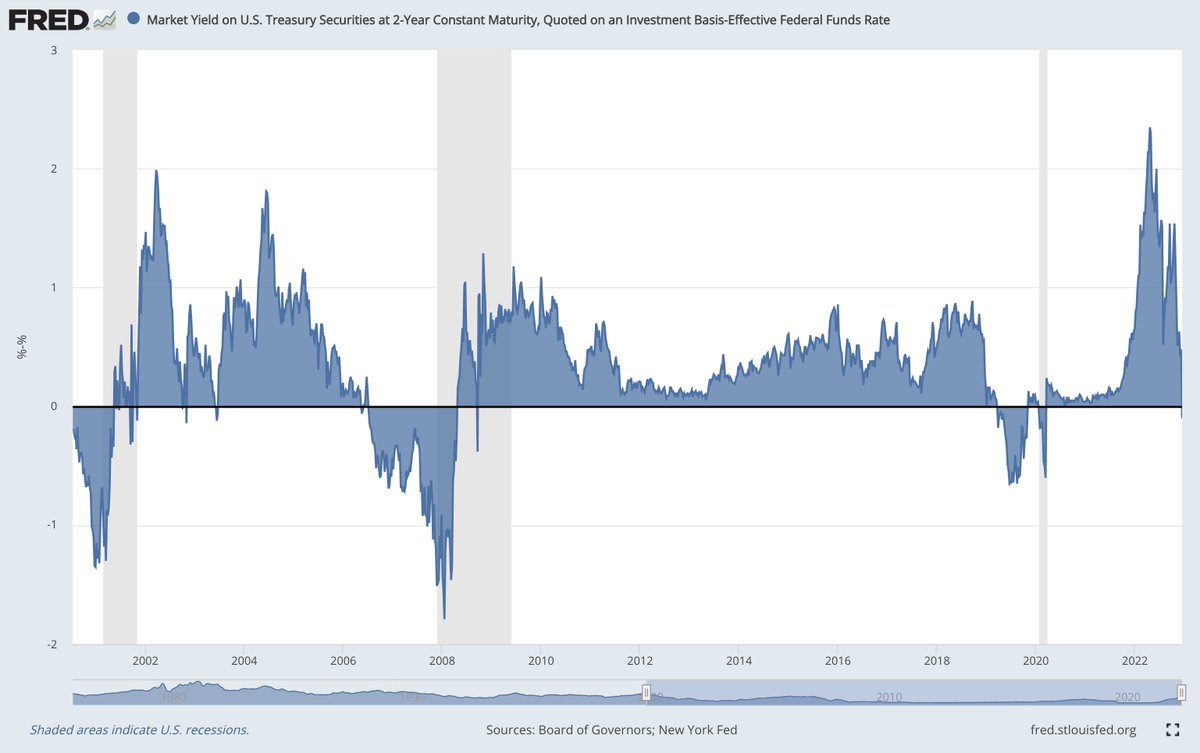
The curve of the 2Y Treasury yield & the effective federal funds rate has inverted < 0.00%.

This chart shows the rolling spread since 2000.

It will get much more inverted, as we saw in 2001 & 2007, indicating that the Fed isn't done hiking.

Inversions have preceded recessions. @JanWues @APompliano @fxmacroguy @f_wintersberger @Maverick_Equity @rhemrajani9 @JeffWeniger @VailshireCap @LynAldenContact @MacroAlf Conversely, the curve can invert further because of a rapidly declining 2Y Treasury yield.

My expectation is that both occur:
• Fed tightens another +0.75% on the aggregate. Maybe +1.0%.
• 2Y yield declines, or moderates between 3.8% and 4.3%.
Dec 14, 2022 5 tweets 2 min read
“ThE fEd CaN’t RaIsE rAtEs AbOvE 4.0%”

Well, they just did.

If you listened to anyone who said this at any point in the past 12 months, do your future self a favor and unfollow them immediately. This is one reason why I stopped listening to Peter Schiff after 2015.

I believed him that the Fed couldn’t raise rates. Then they did.

Think critically about the flaw of telling the Fed what they can and can’t do. Don’t honk at the red light thinking it will turn green.
Dec 14, 2022 6 tweets 3 min read
The market isn’t selling off because the Federal Reserve raised rates by 0.5%!

The market is selling off because it’s pricing in a terminal rate between 5.0% and 5.5%, based on the midpoint of the dot plot in the SEP.

The market had just gotten comfortable with 5.0%. Image The market got misguided that the path of monetary policy was going to be +0.5% and then +0.25% or pause.
If the FOMC did raise by another +0.25% in the next meeting, then pause after that.

As @JackFarley96 points out, the market still doesn't want to accept a terminal > 5.0%.
Dec 13, 2022 8 tweets 1 min read
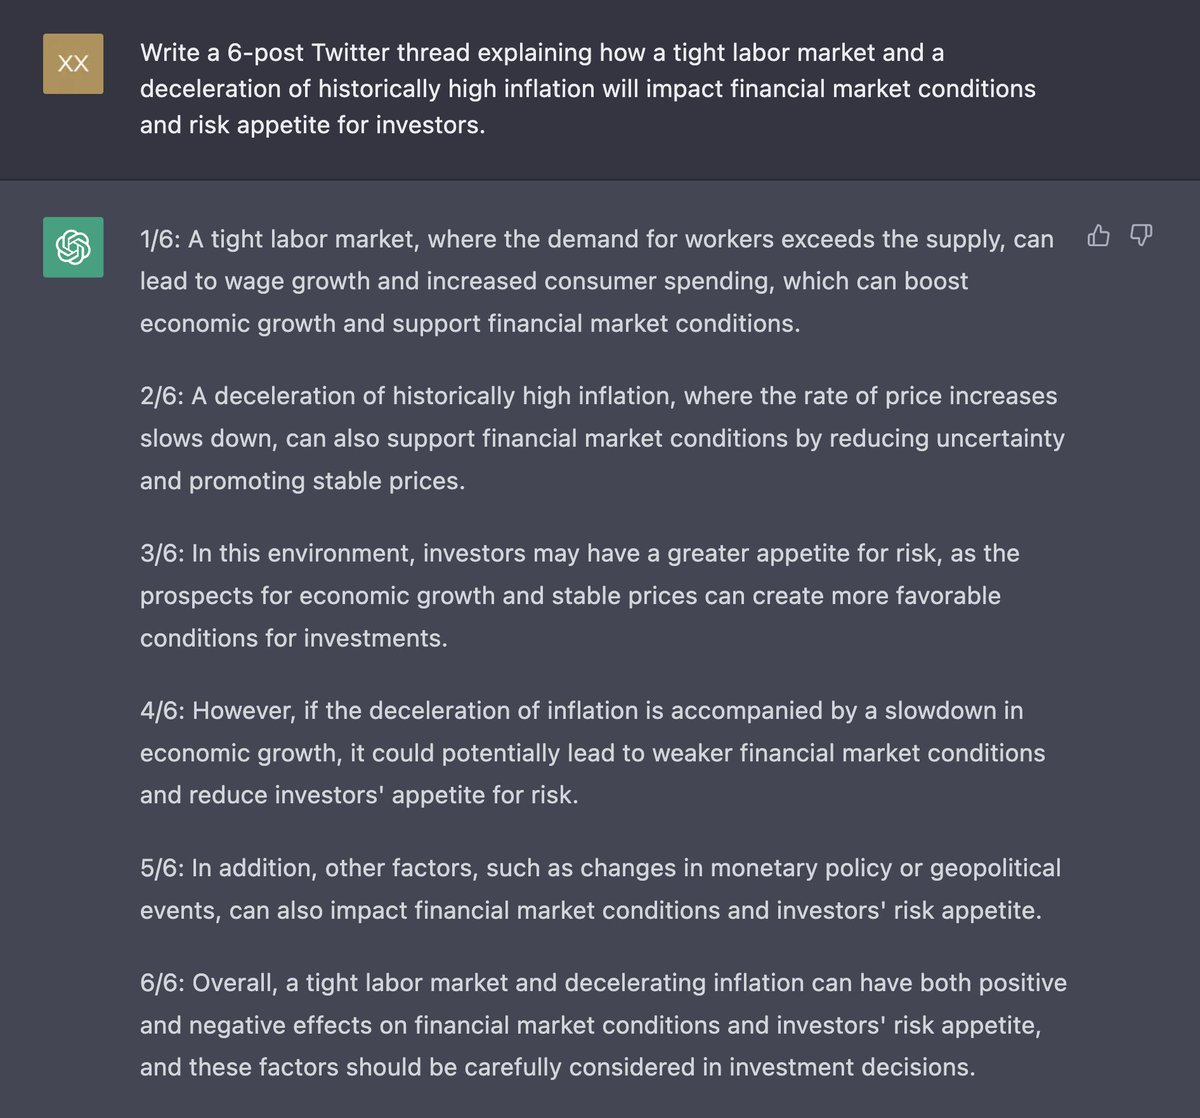
Here's what ChatGPT wants you to know about what a tight labor market and a deceleration of historically high inflation means for financial markets & risk appetite: 1/6: A tight labor market, where the demand for workers exceeds the supply, can lead to wage growth and increased consumer spending, which can boost economic growth and support financial market conditions.
Nov 15, 2022 11 tweets 3 min read
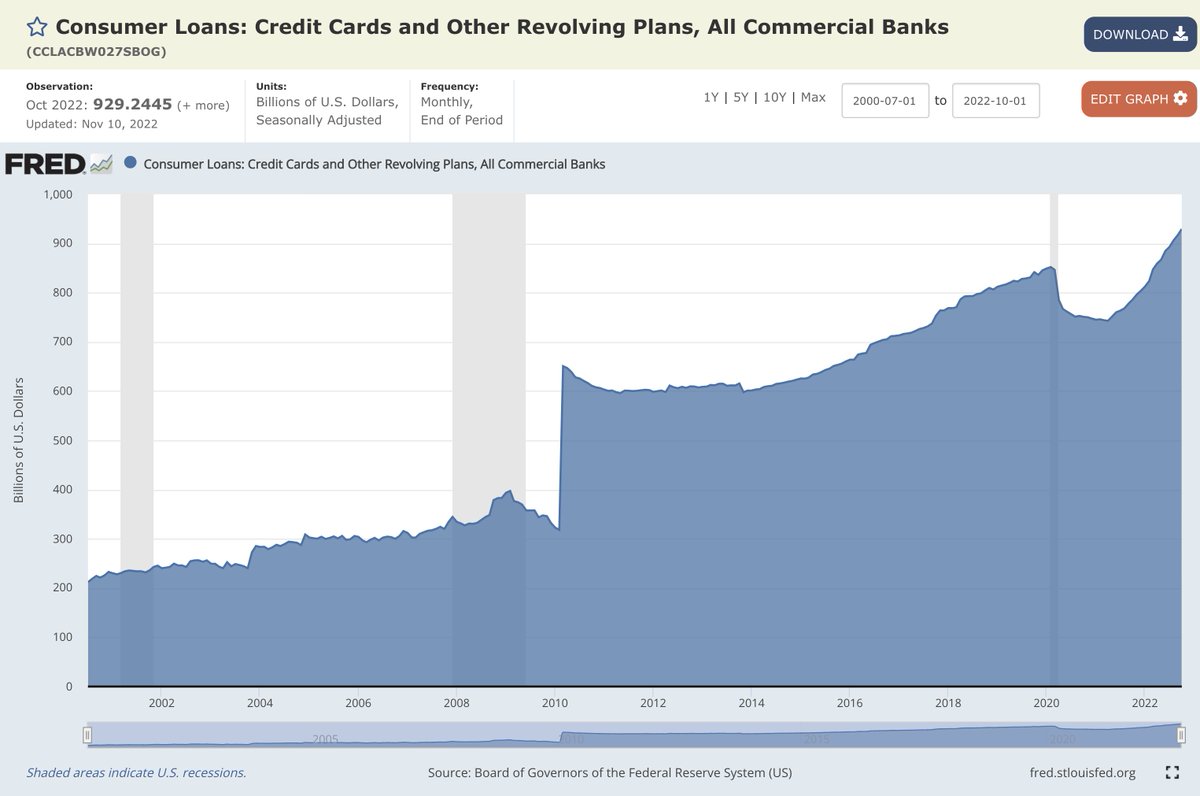
Everyone focusing on credit card balances hitting all-time highs, but no one is focused on total credit card availability or debt-servicing costs relative to personal disposable income. Credit risk is a function of many things, but primarily:

1. Debt service cost, aka principal & interest
2. Time
3. Income/revenue to repay

If you only focus on P&I, but don't focus on the other sides of the equation (time & income), you're missing half the picture.
Nov 15, 2022 4 tweets 1 min read
Bulls should be optimistic about the fact that riskier segments of the stock market are finally leading the way higher.

For over a month, the Dow Jones was outperforming other indexes to the upside & to the downside.

In a bottoming process, investors want to see risk lead ↑ We've seen riskier buckets of stocks leading the way higher since last Thursday's results for the October CPI data.

Risk assets were waiting for confirmation of decelerating inflation. At this point, the market has the confirmation it needs.

Since last Wednesday's close:
Nov 15, 2022 4 tweets 1 min read
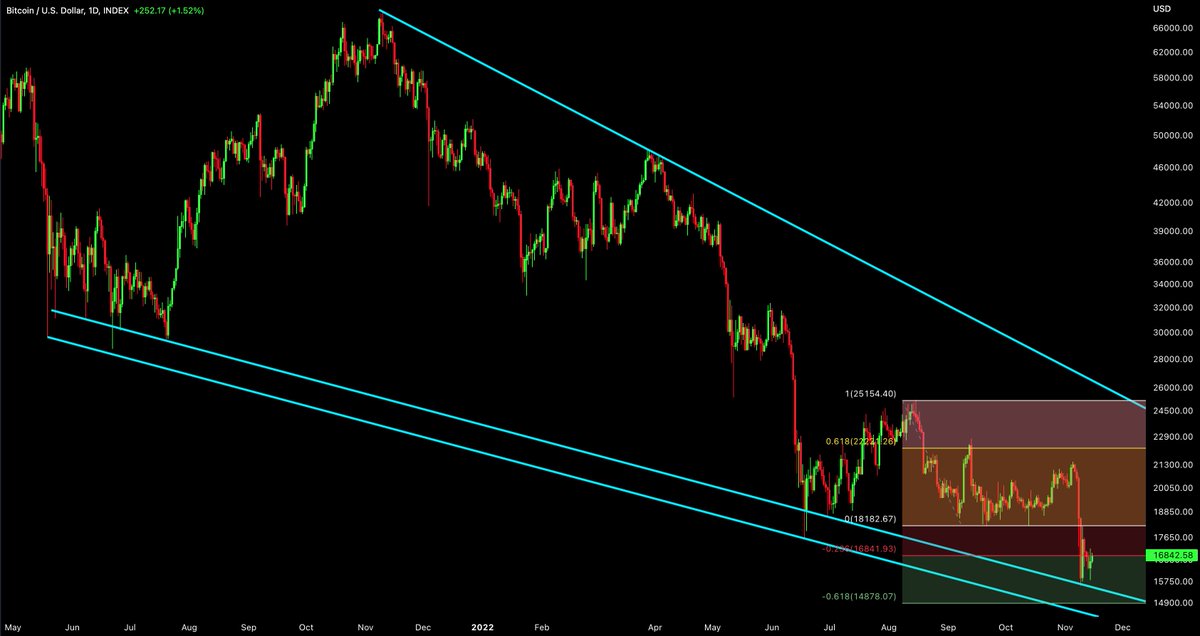
Placed a limit buy order for #Bitcoin at $14,880. Why $14,880?

Take the fibonacci from the Aug. highs to the Sept. lows...

Typically, the 161.8% level gives an upside target in a bull market & the -61.8% gives a downside target in a bear market.

The -61.8% level aligns perfectly with the lower-bound of the wedge. Image
Sep 8, 2022 5 tweets 1 min read
Market timing is extremely difficult.

Here's how I'm thinking about asset allocation right now, using $GOOGL as an example. 1. Broadly speaking, there are excellent companies trading at much more attractive valuations than they were 9 months ago.

Short-term market risks remain to the downside, but I unequivocally want to be increasing my exposure to long-term assets that I have high conviction in.
Jul 1, 2022 4 tweets 1 min read
I'm officially renaming Solana to "SolanaBubble" $SOL Image It's followed classic bubble structure, rhyming instead of repeating prior bubble boom/busts.

Here's the Nasdaq-100 in the Dot com bubble. Image
Jun 26, 2022 6 tweets 5 min read
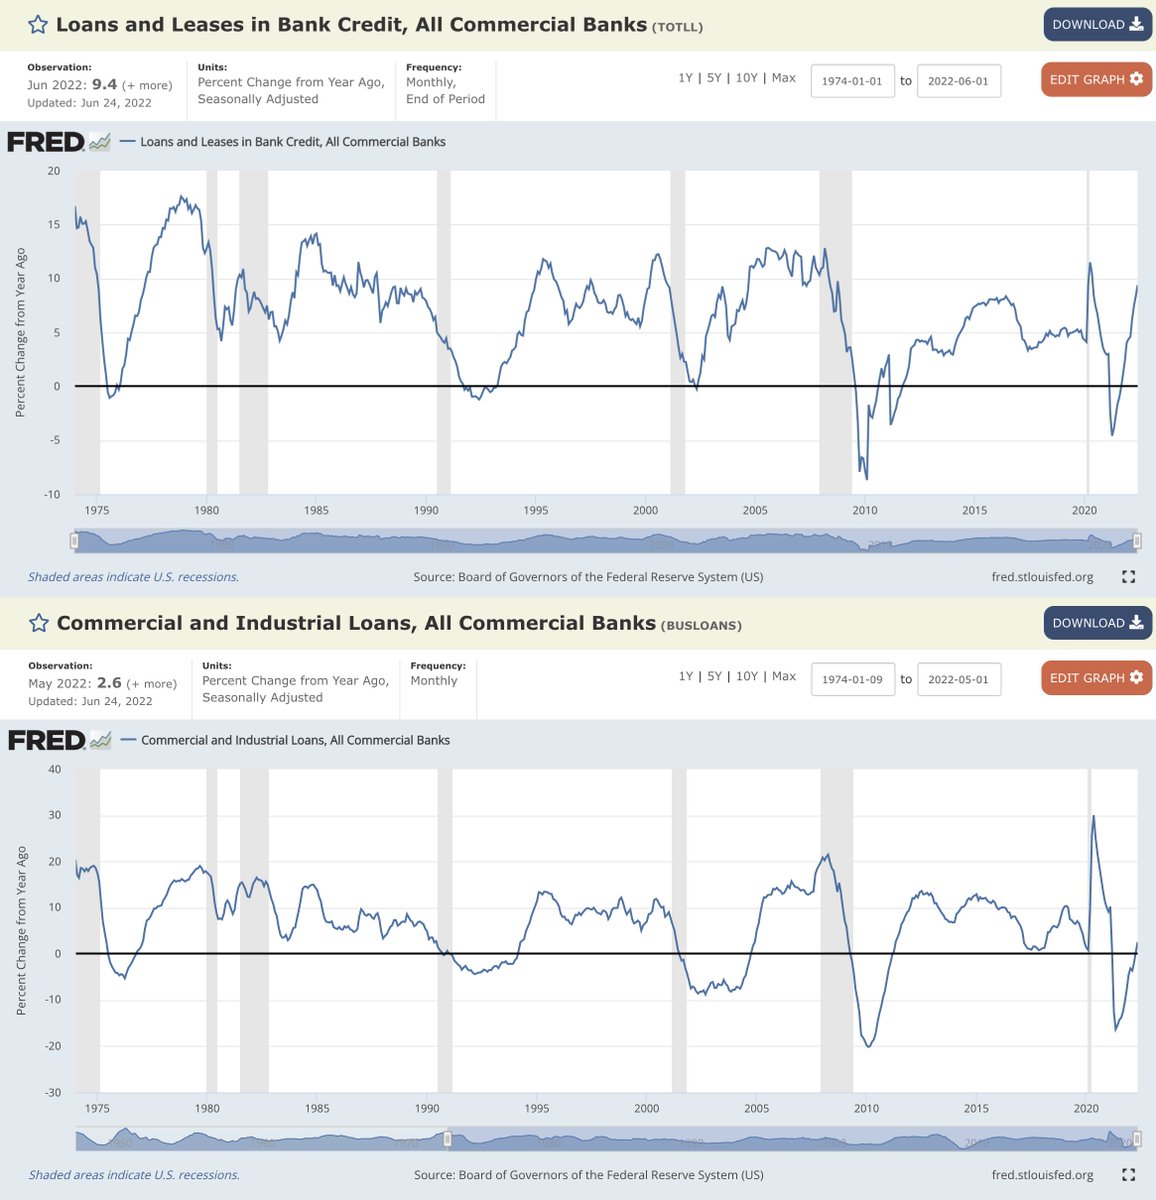
Analyzing the YoY rate of change in credit creation since 1975:

• Top = total loans & leases (L&L)
• Bottom = commercial & industrial loans (a subset of L&L)

Credit creation is rising at a strong pace, with L&L +9.4% YoY and C&I loans up +2.6%.

C&I lagging, but positive. Meanwhile M2 growth is still expanding, but at a significantly slower rate than it was post-COVID.
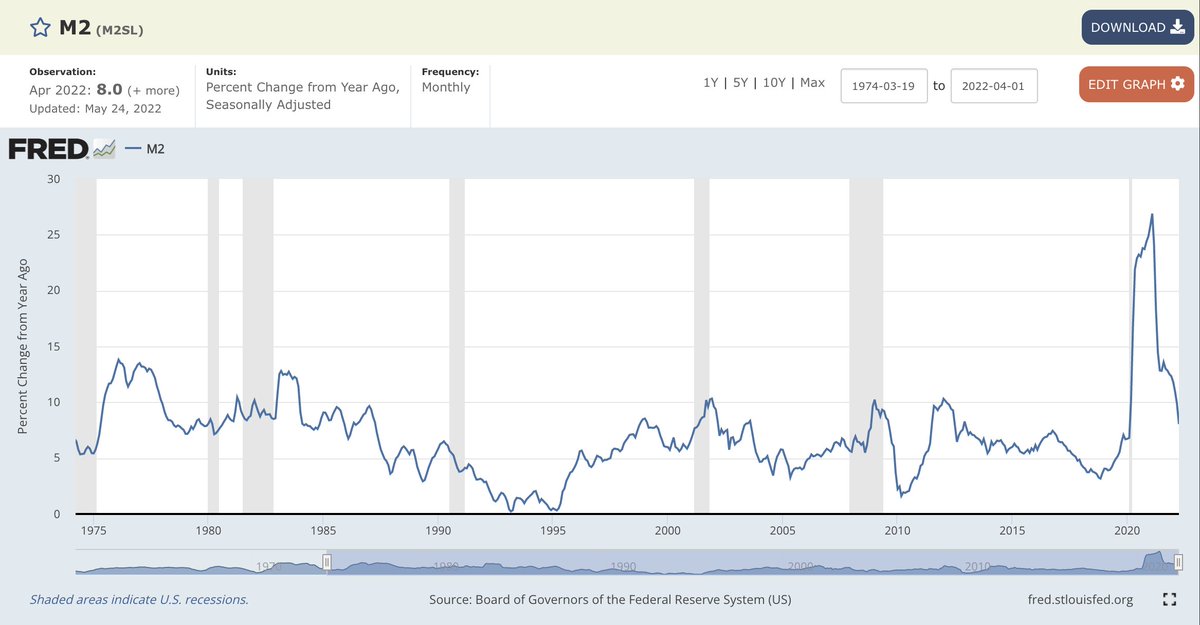
As the Federal Reserve embarks on balance sheet runoff, this number is expected to fall dramatically. The question is how long they can operate QT?
Jun 19, 2022 4 tweets 2 min read
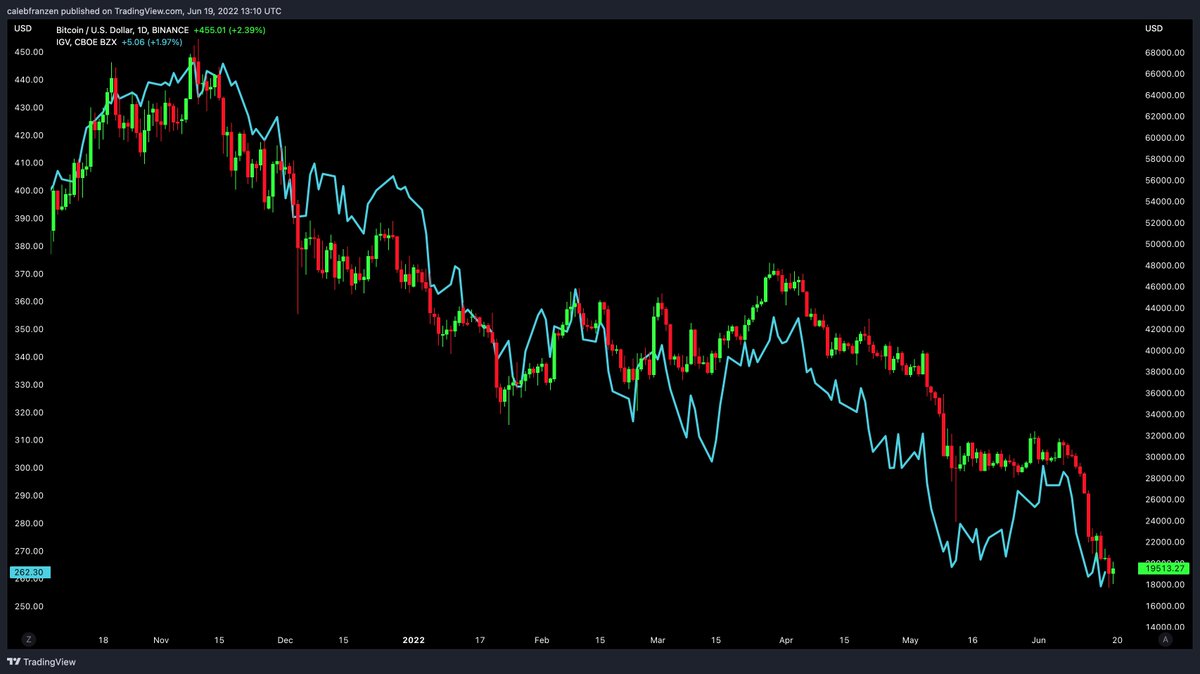
Serious Q: If liquidations were materially impacting the price of #Bitcoin, wouldn't we see a deterioration in price relative to the iShares Expanded Tech ETF $IGV (teal)?

Liquidations would theoretically push $BTC significantly lower than $IGV, but it's not happening. Why? Let's analyze $SOL (candles) vs. $IGV (teal) since the peak in Nov.'21.
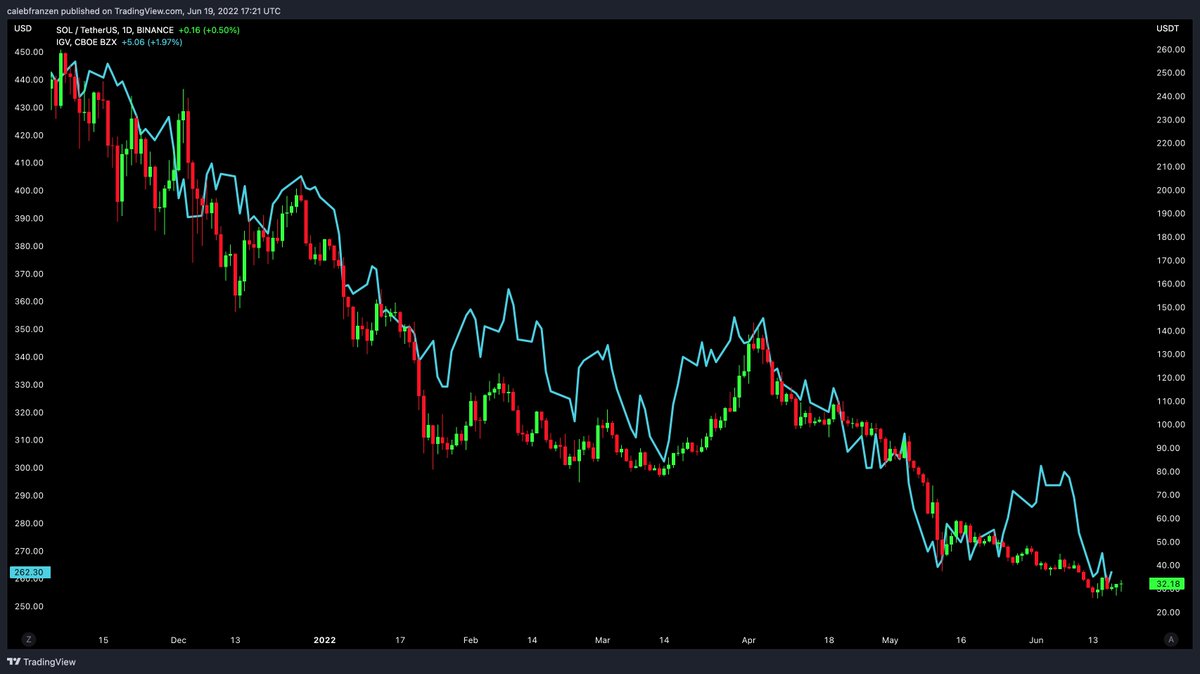
Perfect correlation, indicating that investors view crypto as leveraged exposure to tech stocks. Said differently, crypto & tech are impacted equally by higher yields.

Impact of liquidation seems overhyped.
Apr 21, 2022 4 tweets 1 min read
Want to know where monetary policy & inflation are going? Just watch yields...

5-year Treasury Yield Index $FVX +4.6% today
10-year Treasury Yield Index $TNX +3.7%
30-year Treasury Yield Index $TYX +3.4%

All are trading at multi-year highs. $FVX January 2018 - Present:
Apr 21, 2022 5 tweets 3 min read
I was inspired by @AurelienOhayon's recent analysis, overlaying $BTC's price with the Stochastic oscillator of the S&P 500.

B/c #Bitcoin is so tightly correlated to $IGV since October 2021, I implemented the analysis w/ $IGV's stochastic.

Beautiful signal! But it gets better... I calculated the forward returns for #Bitcoin after $IGV's Stochastic crosses the lower-bound.

The data is EXTREMELY strong on a variety of timeframes! The Aug.'11 signal is the clear outlier, flashing at the beginning of the drawdown.

Stochastic: Weekly candles, %K length=42