ChartsBTC Profile picture
Passionate about #Bitcoin, data, and charts. #DCA and #HODL advocate. Nostr: #npub1umh9k3yuygx7l6nrwwu20c28e27k0s4ak5qk3p4lvzt2836rtfsse626me
Feb 29 ā€¢ 7 tweets ā€¢ 3 min read
šŸ§µ Bitcoin Cycles Comparison šŸ“‰šŸ“ˆ

1/7 #Bitcoin ROI Per Cycle
Bitcoin cycles laugh at "bubble" claims. Post-correction, it's historically still up by hundreds/thousands of percent, ready to do it again. Image 
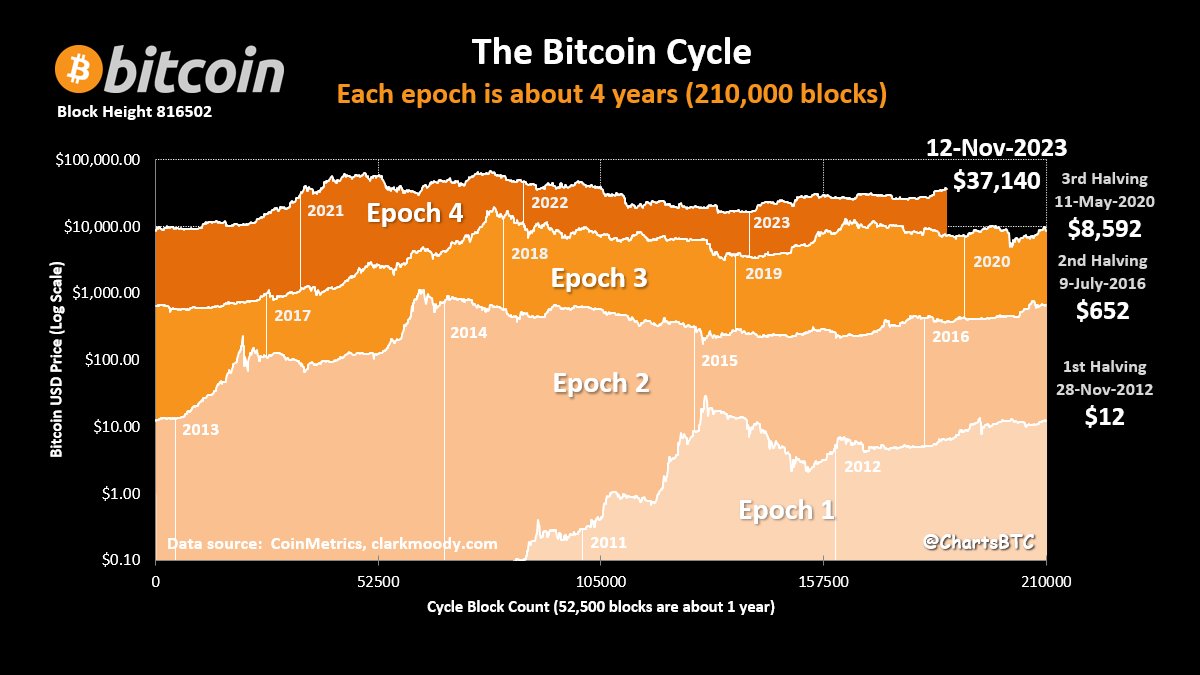
2/7 The Evolution of #Bitcoin
A quick glance at the growth of Bitcoin from halving epoch to epoch shows a clear pattern. Each epoch so far has maintained a price above the previous one, showcasing remarkable growth cycle over cycle. Image
Nov 18, 2023 ā€¢ 9 tweets ā€¢ 3 min read
When I first discussed #Bitcoin's 4-year cycle, it seemed a mere coincidence to many. There are many ways to compare the cycles but here is an overview to get started. Let's dive in... a thread šŸ§µšŸ‘‡ 1/8 Image 
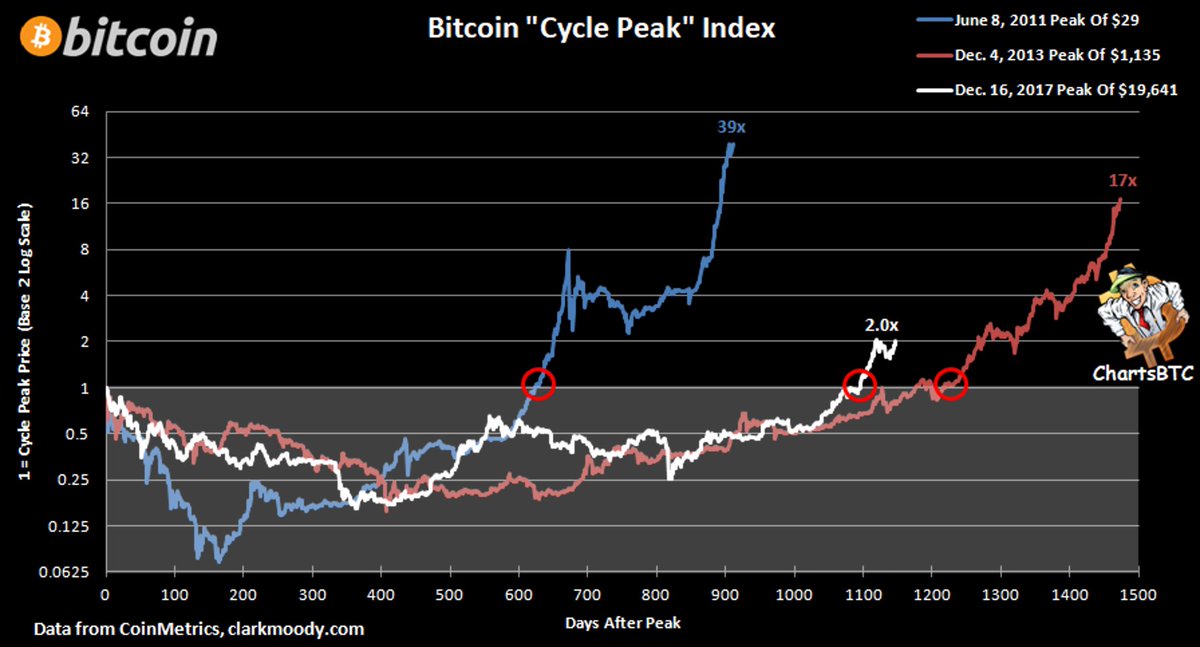
The 'Halving Price' Index shows #Bitcoin's reaction to each halving's supply shock. Global liquidity also influences prices, and with central banks possibly pivoting, the debate on what the primary driver is will likely continue for years to come. šŸ§µ2/8 Image
Jun 17, 2023 ā€¢ 11 tweets ā€¢ 4 min read
#bitcoin chart thread starting with Yearly Candles /1

I've been MIA lately. The current algorithm hasn't been providing the dopamine I got used to. Here's a week of charts in one thread. Let see if the algorithm likes it. If you want me to post more, like and retweet. Image bitcoin on this date /2 Image
Feb 21, 2022 ā€¢ 7 tweets ā€¢ 4 min read
#bitcoin halving regression - There are many #bitcoin regression curves but what if we excluded the blow off tops and crashes and ran it only on just the 3 halving prices? This is the result.šŸ§µ /1 
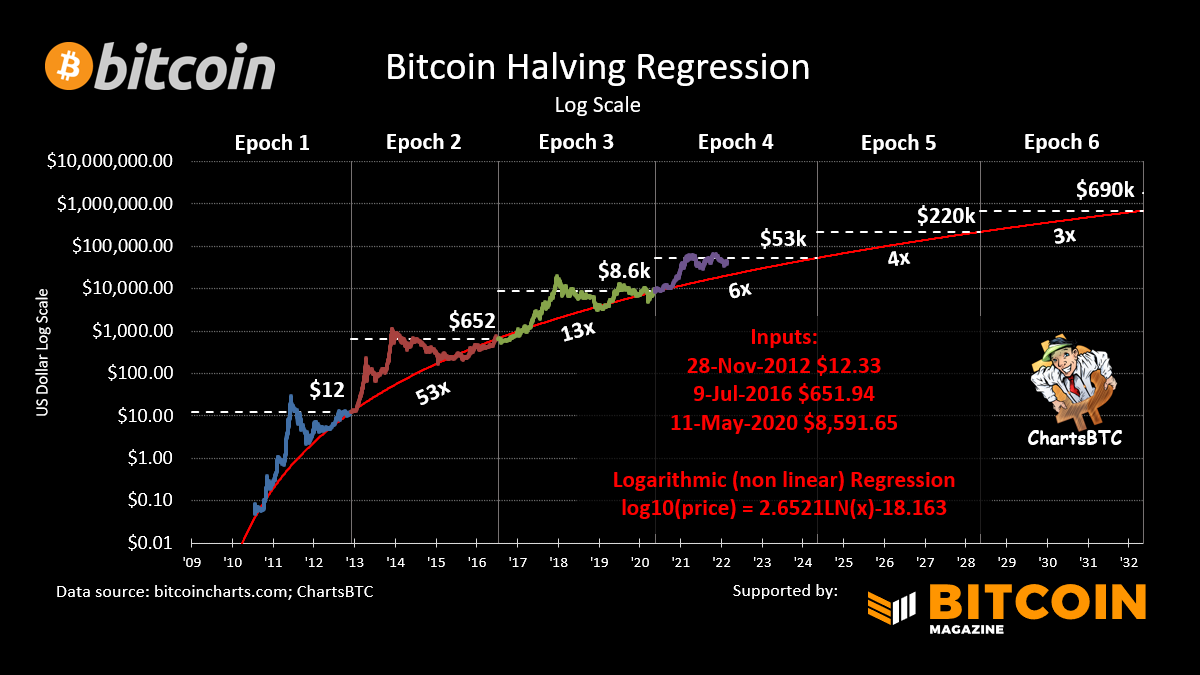
It follows the lower bound of bitcoins price history surprisingly well. By definition, this type of model will show diminishing returns with an estimated increase of 6x this epoch, 4x next epoch and 3x for the one after that. /2
Apr 4, 2021 ā€¢ 7 tweets ā€¢ 4 min read
1/ Slicing and dicing the #bitcoin price history
TL;DR current cycle is above the prior cycle 2/ #bitcoin halving index (before & after) by block count
Apr 3, 2021 ā€¢ 5 tweets ā€¢ 6 min read
#bitcoin candles #bitcoin 200 day simple moving average and mayer (mimble) multiple
Feb 28, 2021 ā€¢ 5 tweets ā€¢ 3 min read
#bitcoin New ATH Index
I've compared the cycles every way I can think of. This is the only one where the current cycle isn't significantly ahead of the 2017 cycle and it's still very bullish long term. #bitcoin Cycle Peak Index
The prior chart aligns the break above the prior ATH (red circles).
Feb 6, 2021 ā€¢ 5 tweets ā€¢ 3 min read
#bitcoin new ATH index #bitcoin prior cycle peak index
red circles show what the prior chart aligns