Pensjonerad Profile picture
memento mori
Paul Melzer Profile picture Anthony Witecki Profile picture Unbekoming Profile picture Kim Profile picture Michael Trumper Profile picture 7 subscribed
Feb 22, 2022 4 tweets 2 min read
1/4 🇸🇪 🇩🇰 so many things happening globally but I think there is room for the Nordic age standardised mortality rate comparison. Last year I envisioned that I wouldn’t be interested in putting together this graph again since everything would be different re restrictions. >> Image 2/4 Little did I know that anti-vaxxer was going to be the most used derogatory term of the year and vacc.passports were going to be introduced only to be removed after they showed little to know benefit.

Currently all restrictions are dropped and life returns to normal…>> Image
Feb 4, 2022 6 tweets 2 min read
1/6 🇸🇪 When we lift restrictions it’s worth reflecting on one of the measures, the vaccine passports implemented to restrict unvaccinated. Although rather limited in its application, they were nonetheless implemented. This was at a point when vaccine coverage were already… >> 
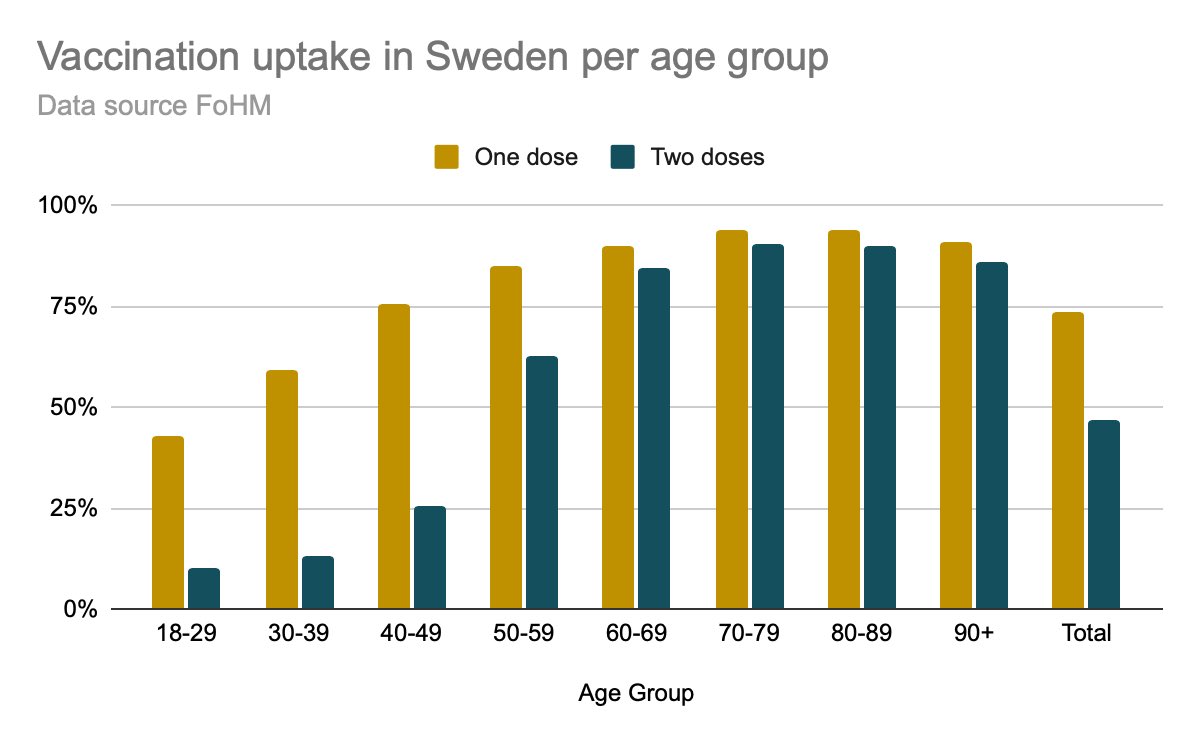
2/6 pretty high. It now stands at 83,6% fully vaccinated in +12yo and ca 75% in age group 18-29. Older age groups have high coverage with around 90%.

This means that for the age group 18-29, with low covid related mortality, ca 25% have been excluded from certain activities >>
Jan 11, 2022 9 tweets 3 min read
1/9 In the before times, it was speculated that the Swedish experience during 2020 would result in lower mortality during 2021, this - for various reasons (excess mortality 2020 and 💉…) - seems to have become the case >> 2/9 It was also agreed that covid posed much less risk for younger people… now my 20 something year old colleagues - some of whom have had covid - are expecting to get boosted for the betterment of who exactly? >>
Nov 1, 2021 5 tweets 1 min read
1/5 🇸🇪comparing covid19 deaths unvacc and vacc (1+2 doses) between July and mid October.

Age group below 70: Ca 1,6 times as many non-vaccinated have died comp to vaccinated.

All ages: ca 4,8 times as many vaccinated have died compared with unvaccinated >> 2/5 comparing from reported covid cases in each group (vacc/non-vacc)

Age group below 70: 0,14% CFR in vacc group compared with 0,07% in non-vacc group.

Age group above 70: 8,81% CFR in vacc group compared with 13,20% in non vacc group >>
Oct 6, 2021 8 tweets 4 min read
1/8 🇸🇪 FOhM have chosen to pause the Moderna vaccine for those under 30 due to increased risk of… and it actually not being worth it🤭 In any case, the pandemic so far, in terms of mortality hve been looking quite mild for the young. This extends to the period of vaccinations >> ImageImage 2/8 And as I mentioned the other day, irregularities will stand out but might be due to many many factors.

Historic reference—> I read somewhere that some 400 individuals ended up with narcolepsy after the swine flu debacle. This was, at the time, a rather significant impact >> ImageImage
Sep 28, 2021 4 tweets 2 min read
1/4 🇸🇪 -21, the year when reported AEs from vaccines exploded, why? Perhaps nobody new it was supposed to be done prior to 2021😐

Over 78k reports have been filed to Läkemedelsverket of suspected AEs. Ranging from mostly mild headaches to rare worse AEs (severe AEs in graph) >> 2/4 on a “normal” year it seems far less reports are being filed. Up until now it ca 10k covid related reports have been processed (priority given to severe AEs) and of those some 6k are considered severe AEs. See graph above👆🏽 >>
Sep 22, 2021 8 tweets 3 min read
1/8 🇸🇪 a short thread on in-patient care comparing 2020 with previous years. Including both care type +24h and care type less than 24h. 🏥

This graph shows number of patients per 100’, both care types and all causes for hospitalisation.

Slightly lower 2020 than prev years >> 2/8 This graph shows average care time for all +24h care types.

Year 2020 slightly lower than previous years. >>
Sep 12, 2021 6 tweets 3 min read
1/6 The hill to die on?

The idea of mandating vaccination —> 💉 passports, a prerequisite for employment etc is morally questionable but even more so for the young.

Using age group 20-29 in Sweden as an example👇🏽 total number of c19 deaths —> 16 according to Socialstyrelsen >> 
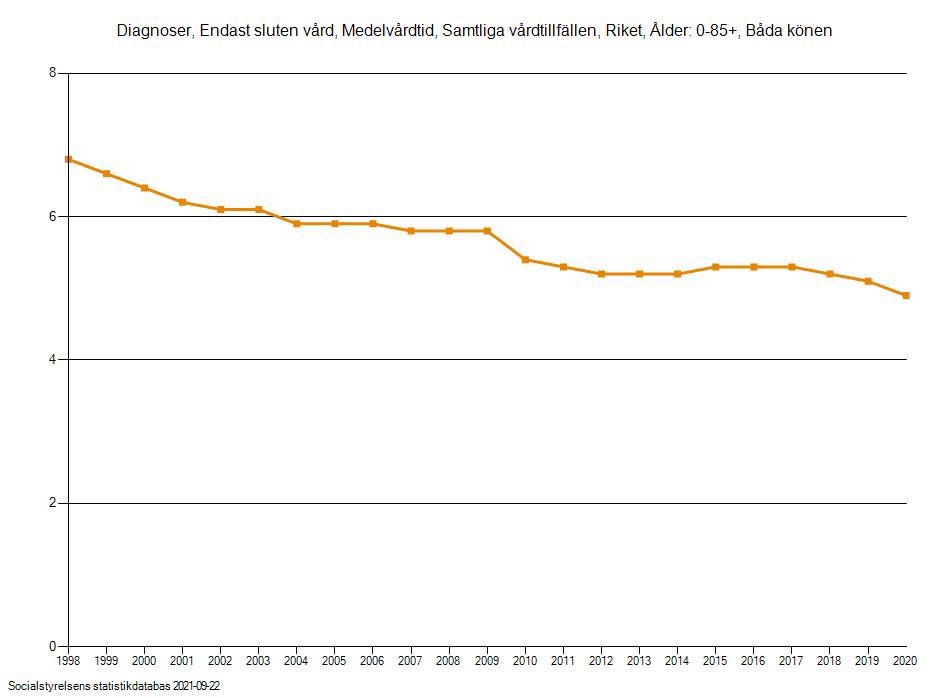
2/6 By all means, make vaccination available🙏🏼 and encourage if you will🧐 but the coercive methods/strategies we see from certain directions is nauseating.

Mortality looks pretty light blue to me👇🏽up to age 79… for heavens sake >>
Aug 24, 2021 11 tweets 4 min read
1/11 🇸🇪 update of three charts including June and July with all cause mortality.

Additionally gathering some of my previous graphs in 🧵👇🏽👇🏽👇🏽which I have been meaning to do for some time >> 2/11 and… last couple of months have all been below average of 15-19 mortality as provisional 2021 data reveals, 1, 2… 6 consecutive months >>
Jul 28, 2021 4 tweets 2 min read
1/4 🇸🇪 How high is the vaccine uptake in Sweden? Well, some 75% have received one dose and almost 50% have received two doses and for people aged above 50 this number is even higher i.e those most at risk >> 2/4 it’s still important to remember how the risk varies between age groups why it’s so odd to increasingly hear people in support of vaccine bullying i.e no vaccine = not allowed to fully re-enter society >>
Apr 26, 2021 5 tweets 2 min read
1/5 NORDIC follow up. Mortality per 100 000 stratified into three age groups:
0-19
20-64
65+

First age group 0-19, fluctuates around similar mortality year to year >> 
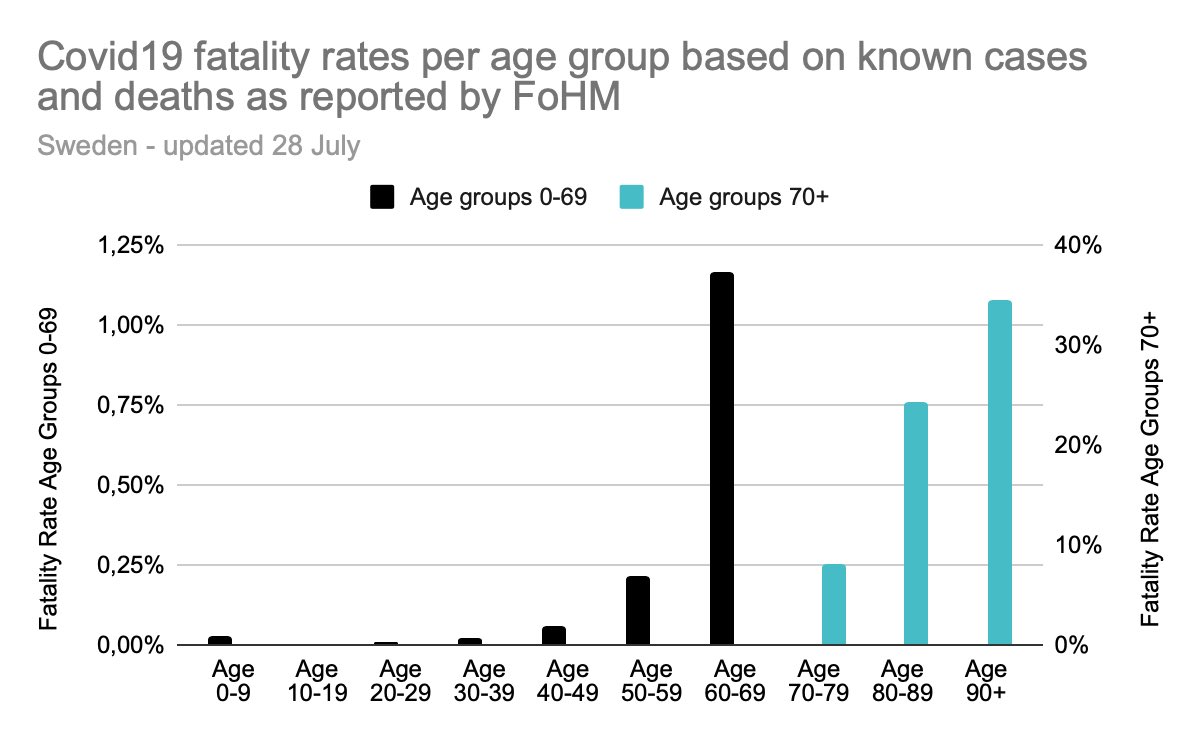
2/5 Age group 20-64👇🏽
It now seems apparent that in the younger age groups Denmark has higher mortality rates than its Nordic neighbours in age group 0-64 and Finland higher at least in 20-64 >>
Apr 12, 2021 6 tweets 2 min read
1/6 🇸🇪 Update all cause mortality April through March (March included, 2021 provisional)👇🏽red line indicates 20/21 mortality rate compared with previous 30 year period.

In next tweet update of monthly mortality rates including March as well >> 
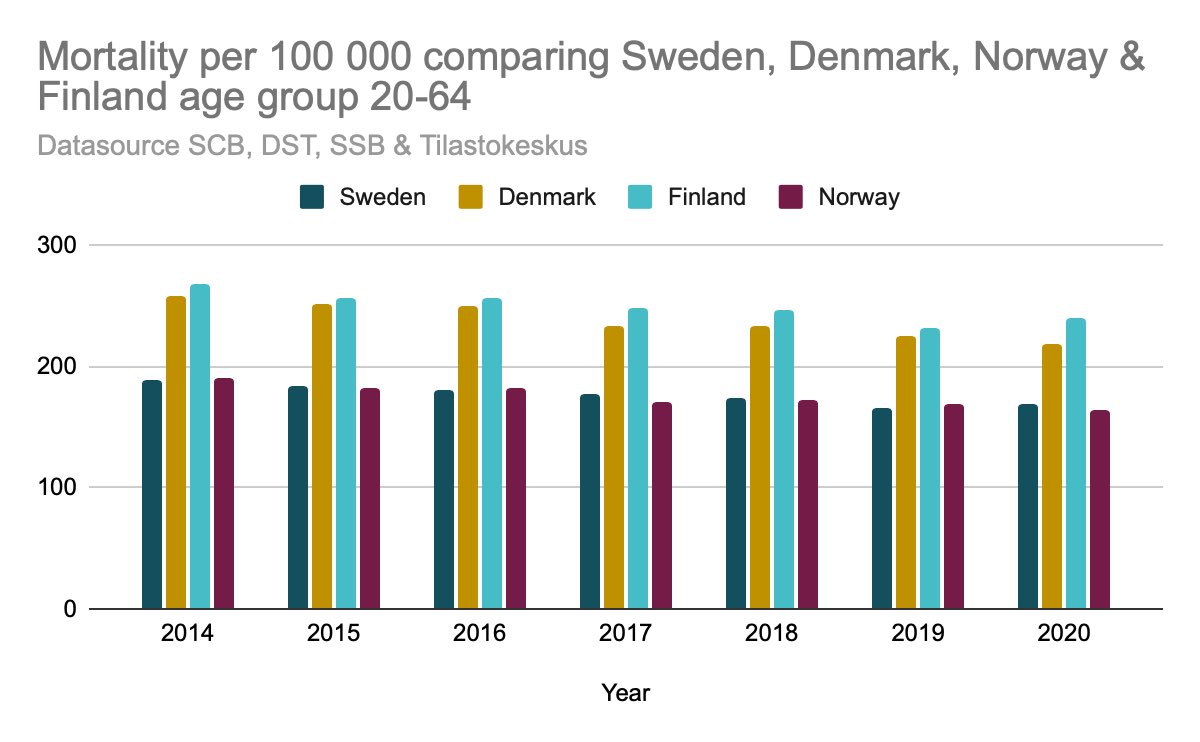
2/6 comp mortality rates per month to average of 2015-2019. Including March 2021 (prel figures as reported by SCB). So far, Feb and March below average mortality. March will be adjusted upwards.

Recently uptick in ICU, how will it compare with April of 2020? we will see >>
Mar 9, 2021 5 tweets 3 min read
1/5 🇸🇪 if anyone is interested in moving to Swe I’ll present to you a couple of figures from the Swedish temperature record. Also, fun to look at something than covid for a change☺️

This is an incomplete picture of Swe temp but enjoy an average of 8 Degrees >>

#usewithcaution 2/5 if you stay in the southern parts with local temperature variances ofc👆🏽. You will find the south slightly warmer than the north and >>
Jan 5, 2021 6 tweets 2 min read
1/6 🇸🇪 patients to emergency rooms (somatiska akutmottagningar) declined during 2020. Ca 159k fewer patients (emergency room) during 2020 compared with 2019 (period March-September). Partly as a result of people being afraid but also due to other causes. Blue line is... + Image 
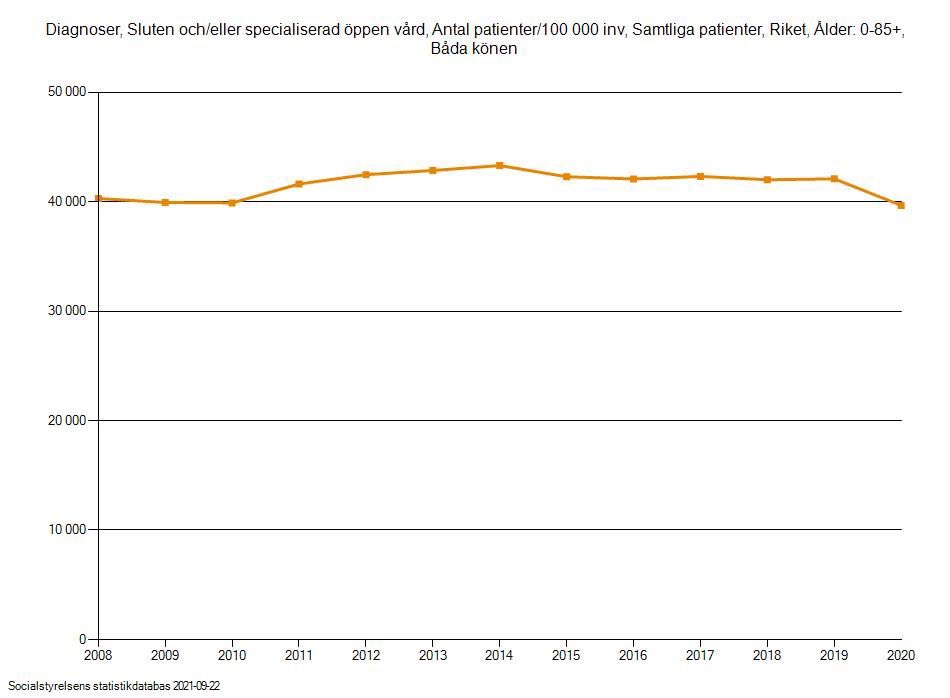
2/6 total patients to emergency room during 2020 and it’s per 100k.

This chart👇🏽 presents data per region as deviation from average of 2017-2019. We see sharp declines most notably i Gothenburg region (Västra Götaland). + Image
Dec 11, 2020 6 tweets 3 min read
1/6 🇸🇪 pre weekend update
-ICU admissions
-ICU total
-covid-19 deaths per day ma7
-regions (cases + ICU)

For the moment ICU admissions have reached a plateau with peak lower than during spring + 2/6 also we can see that total ICU beds occupied by covid patients in Sweden have reached a - so far - lower peak/plateau than during spring. As is known, Sweden have a low ICU beds per capita capacity which however can be increased, as was did during spring. +
Dec 8, 2020 7 tweets 3 min read
1/7 🇸🇪 update including new figures from @Folkhalsomynd
-cases
-ICU admissions
-#covid19 dod
-dive inte admissions and cases (4 regions)

ICU admissions seems to be turning, see following tweets for further details. Deaths yet to show sign of change of direction. + Image 2/7 it seems we now have a week with fewer admissions than prior week🙏🏼 w48 unfortunate climbed ca 17% past w47. Let’s look at four regions 👇🏽+ Image
Dec 2, 2020 5 tweets 2 min read
1/5 🇸🇪 A regional dive into ICU Admissions & cases for
Stockholm, Västra Götaland, Skåne and Uppsala + weekly admissions

Stockholm👇🏽 adding red-line in all graphs which indicate 2 weeks +/-3 days from local advice. You can determine for yourself the possible effect on ICU. + 2/5 Västra Götaland (Gothenburg) seems to have been on a plateau in terms of admissions since around 10 November. +
Dec 1, 2020 4 tweets 2 min read
1/4 🇸🇪 post-weekend update

ICU admissions increase slightly between week 47-48 but less than week before and perhaps less since increase began. Still figure has to stabilise.

In next tweets we look at
- cases
- corona dod
- acm
- acm compared between 4 age groups

+ 2/4 Cases 🆙
There is no sudden spike rather slow increase of other metrics in graph —> ICU admissions and covid deaths... +
Nov 24, 2020 5 tweets 2 min read
1/5 🇸🇪 update
-all cause mortality
-deaths #covid19
-cases
-ICU admissions

First graph - Including week 46 - acm still at or below average for this time of year. During spring with similar c19 deaths per week we already had above average. + 
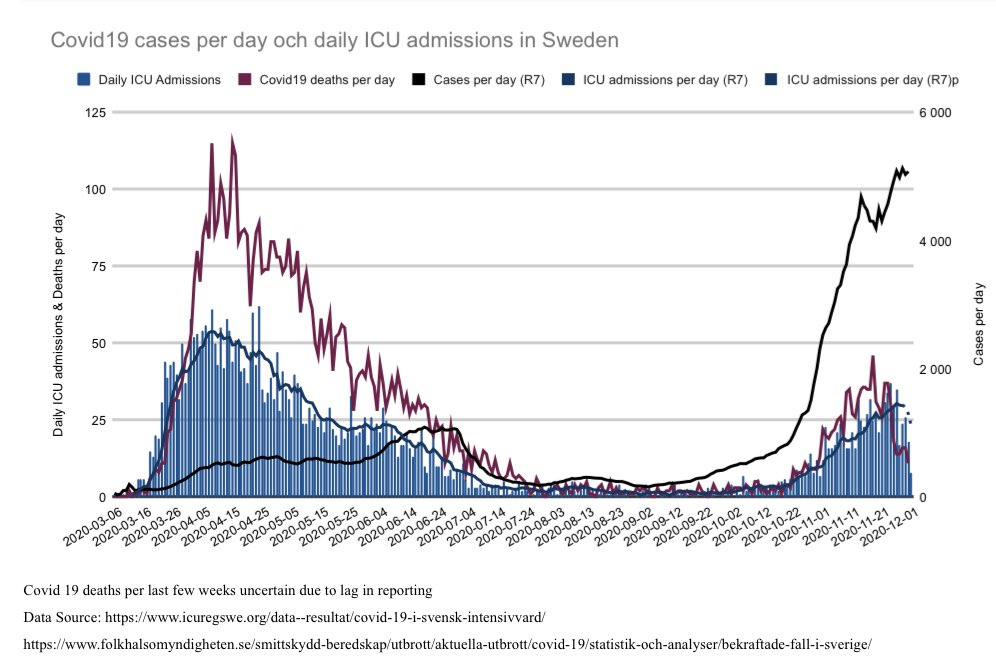
2/ cases turned up again. Slight increase still re ICU admissions in terms of higher general no but not higher peak. +
Nov 21, 2020 21 tweets 5 min read
1/21 🇸🇪 I’ve been looking at cases and ICU admissions lately. In this graphaton 🧵 I’ll present the figures for each region including date of local recommendations - in titel - if there are any.

Stockholm 2/21 Örebro
Nov 17, 2020 5 tweets 2 min read
1/5 🇸🇪 weekly short update👇🏽 w45-46 similar re ICU admissions in Sweden + Image 
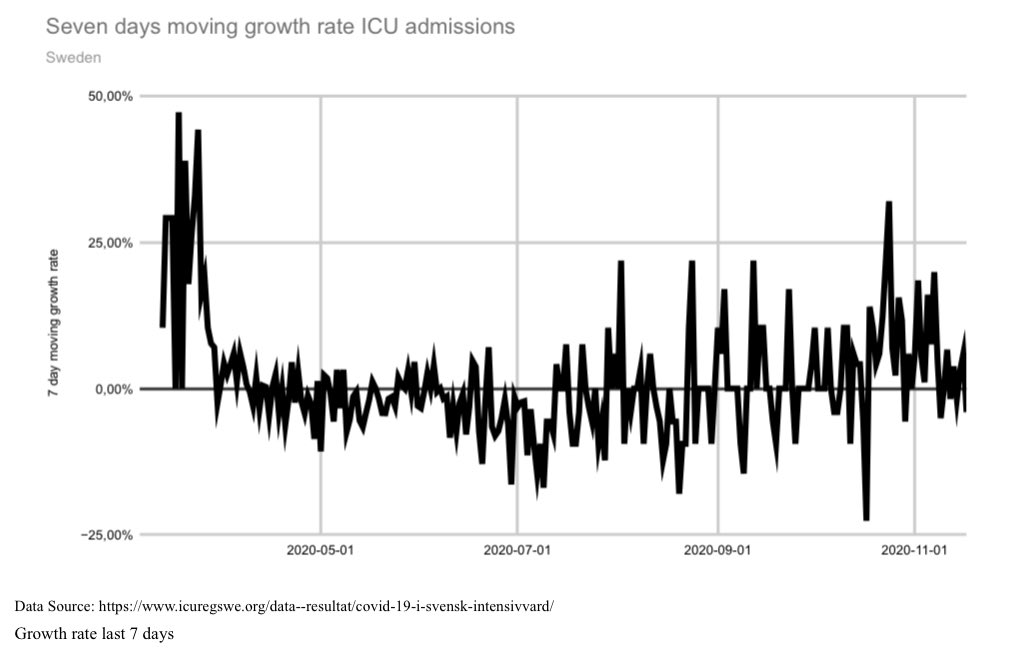
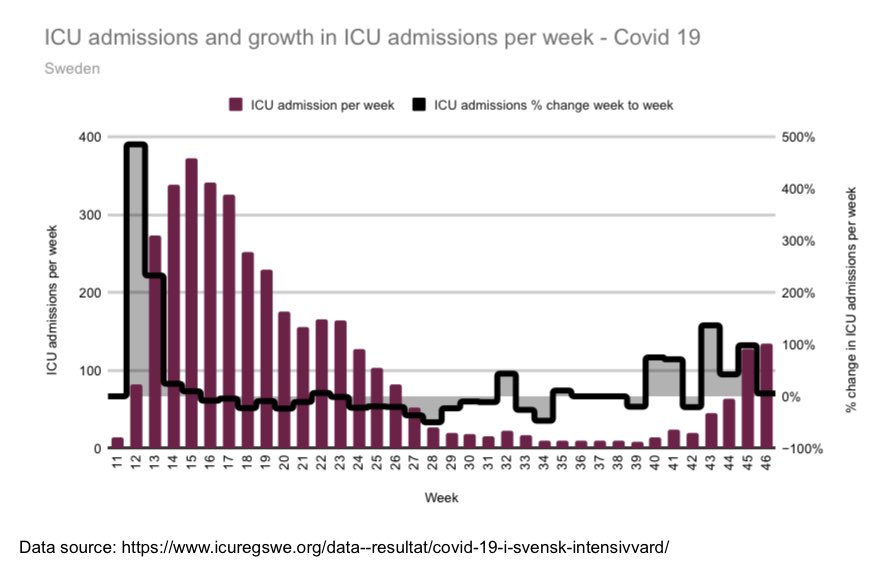
2/5 Growth rate of ICU admissions continues to be slow + Image