Duplicate of Duplicate of Duplicate of Jeff (Weir) Profile picture
I like talking about data visualisation and actionable insights in Power BI, and pushing for better vis & UI/UX. See my sample file here: https://t.co/JSctIX8hoV
Mar 9, 2021 24 tweets 13 min read
1) I finally got the time to upload the latest BabyNames data for NZ and am playing around with it using @ZebraBI. I quite like this view showing the names that appeared in the top N in any given year. Note that a space means the name dropped out of the top 10, not out of use. 2) Instead of bars I could use an area chart....but that doesn't show spikes as well.

(Also, for some reason I'm getting red in some places...on names that I think dropped entirely out of use then came back. Need to explore this further).
Mar 8, 2021 7 tweets 6 min read
Just started watching this...and as a #PowerBI user with no familiarity with #Tableau I'm finding it fascinating to compare things...like how T resizes tooltips dynamically whereas PBI can't (yet) and serves up an unusable toolbar. Great opportunity there, @MSPowerBI. Wow...great colour palette options in #Tableau. And awesome axis flexibility options (and again, really appreciate the dynamic sizing of the tooltips here). Kudos!
Feb 1, 2021 4 tweets 3 min read
I've never played with #PowerBI hierarchies before. It would be cool if PBI allowed databars on multiple levels of the hierarchy at once, with each level colored/shaded differently. Currently databars move automatically to the lowest level as you expand/collapse. Oh cool...If I switch the @ZebraBI table to a WaterFall layout, I can do this...although I've got to color the bars one by one.

@lapajne...how 'bout adding the ability to color an entire level to the backlog?
Jan 31, 2021 18 tweets 16 min read
@BenoitPette @BenoitPette This link doesn't work any more and I can't see the plan at wellington.govt.nz/have-your-say/…

Any idea where it lives now? @BenoitPette Think I've found it via Google. wellington.govt.nz/-/media/have-y…
Oct 6, 2020 11 tweets 16 min read
@marcorus @FerrariAlberto Good timing. Tomorrow I’m using calc groups to implement this dynamic number formatting: @marcorus @FerrariAlberto Awesome: This allows me to create a *dynamic* format string using Calculation Groups and Tabular Editor that automatically renders my data as k, M, bn, tn.

Thanks @DOtykier for TE, and thanks @marcorus, @FerrariAlberto for the awesome tutorials. ImageImage
Oct 1, 2020 12 tweets 6 min read
Before I write my own...do any of you #PowerBI peeps have a DAX statement that dynamically sets number formats to bn, M, k etc? 1/ So the more I play with Custom Number formats in #PowerBI, the more I think the #PowerBI team should talk to the #Excel team.

While inelegant, this works in Power BI. Image
Apr 11, 2020 129 tweets 64 min read
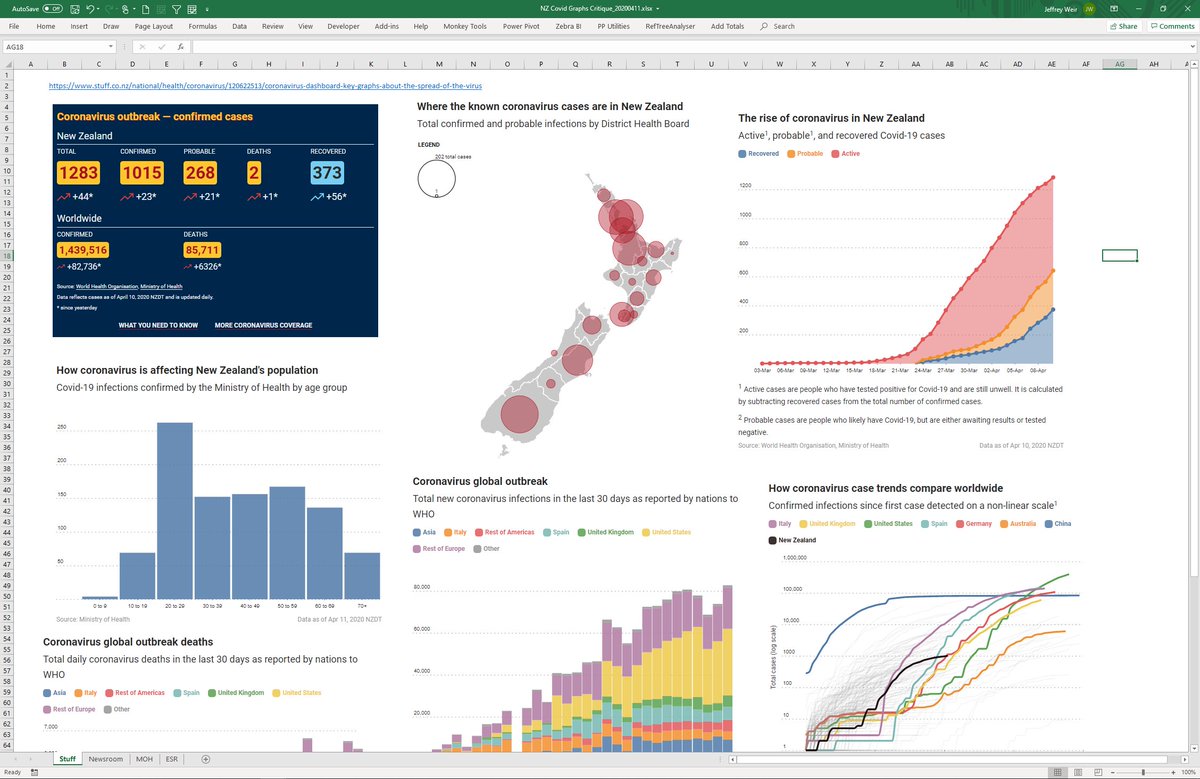
1. Last night I started working on a #Covid19 dashboard for New Zealand that scrapes data from health.govt.nz/our-work/disea…

Today I'm trying to work out how I can best serve up the data experience I want given the strengths, constraints of the tool. I'll live tweet thoughts as I go. 2. First up, I did a critique of existing charts and dashboards covering the NZ situation. I cut them into an Excel doc, with one tab for each provider. Here's a collection of vis from the page at stuff.co.nz/national/healt…