
🇺🇸💪🏽📈🔥🫡 Lead Analyst @HousingWire Financial Truth On Housing Economics. All American Bears have failed since 1790. Press inquiries: Press@HWMedia.com
 🤔🫡
🤔🫡 


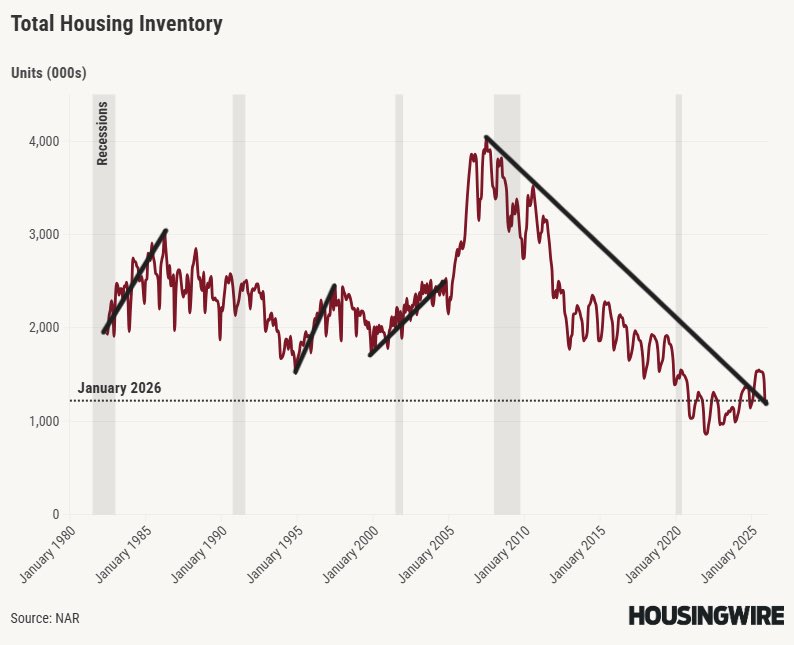
 In general, housing mortgage demand was slow, but back then, the builders also had a lot of competition with an active inventory much higher than today
 Since mortgage rates started to fall after making some Holiday adjustments, meaning I don't count the last few weeks of the year or the First week of January, we have had an 8-week positive trend; we get 12-14 weeks we have something material, as did late 2022 early 2023

 First, we have separated the existing home sales market from the new home sales market. The new home sales market is still growing as they can live in a much lower mortgage rate market.
 Week-to-week data flat
 Trust the data ☺️🙌🏽
 2. We had massive credit stress build-up in 2005, 2006, 2007, and 2008. All before the job loss recession in 2008
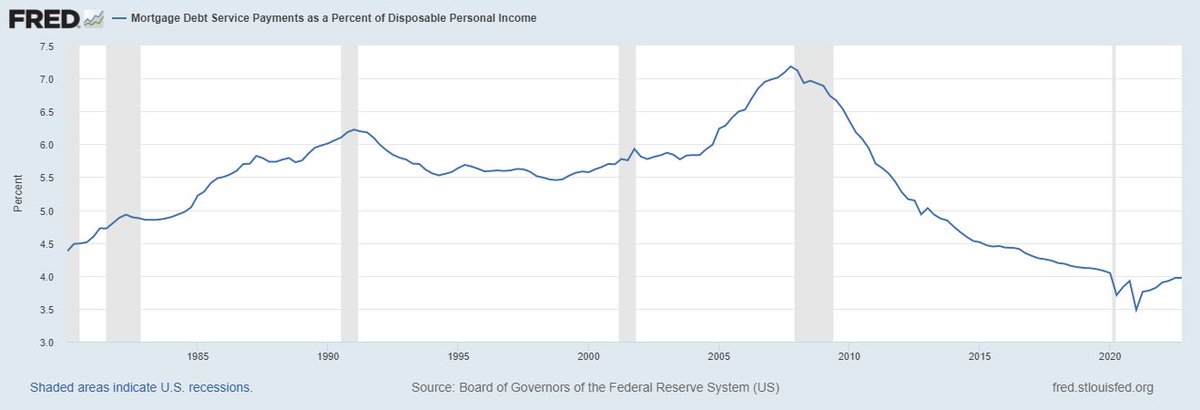 When you have the best hedge on planet Earth on your books, you don't traditionally sell to be homeless when employed.
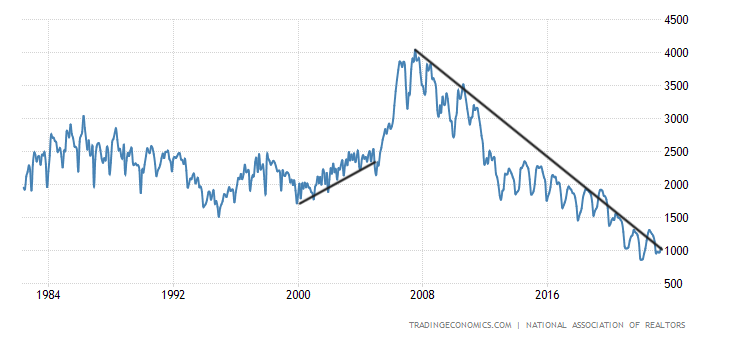


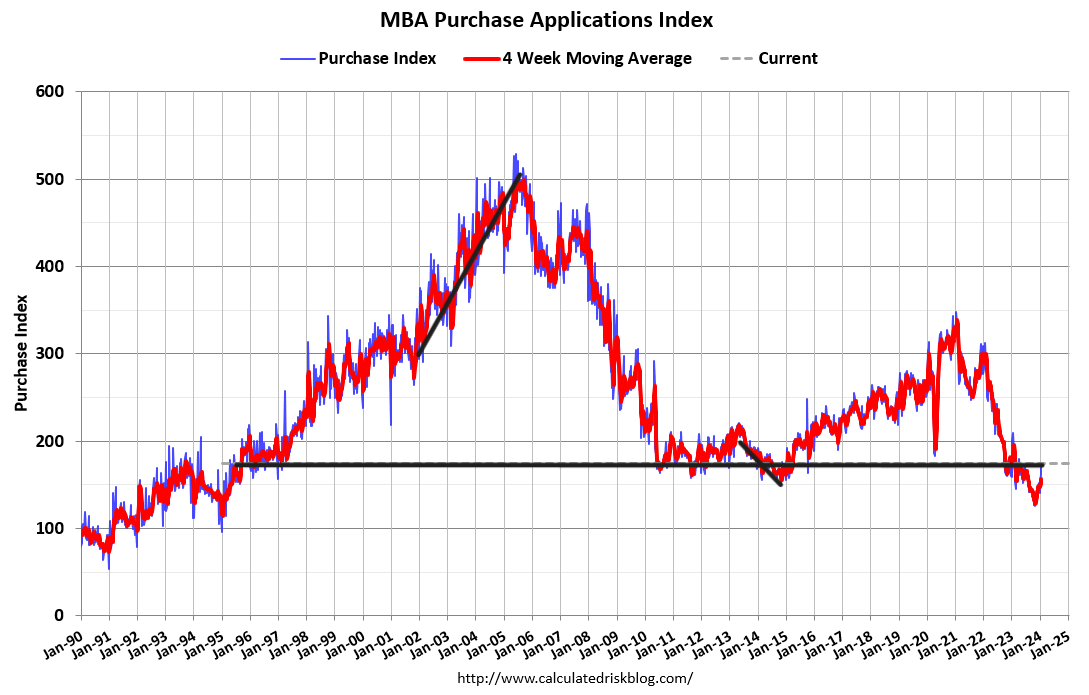
 Year to date, 11 positives vs. 11 negative data
  Even though purchase application data has had more positive purchase apps than negative YTD, not much is happening outside stabilization. Seasonality will be done with this data line by the end of this month.


