Max Roser Profile picture
Data to understand global problems and research to make progress against them. Founder of @OurWorldInData / Professor at @UniofOxford's @BlavatnikSchool
Domingo Gallardo Profile picture Κασσάνδρα Παρί پری Profile picture Leo Profile picture ((Ernesto ElZeide))) Profile picture giovanni dall'olio 🇮🇹🇪🇺🇺🇦 Profile picture 35 subscribed
Apr 3 4 tweets 2 min read
Until 50 years ago, CO₂ emissions developed in lockstep with economic growth in France.

Since the early 1970s, the opposite has been true: emissions declined as people in France got richer. Image To produce consumption-based CO₂ emissions, statisticians need access to detailed global trade statistics. This data is, therefore, not available over the very long run. But it is available for the last three decades and are shown in this chart. Image
May 25, 2023 6 tweets 2 min read
Some statistics are worth knowing by heart:

The average – mean – income in the world per person is $18 per day.

This is adjusted for differences in price levels.

It means that if incomes could get perfectly equally distributed in the world all of us would live on $18 per day. For reference, poverty lines in high-income countries are typically around $30 per day, or a bit less than $1000 per month.

(This is also taking differences price levels into account.)
May 21, 2023 4 tweets 2 min read
Average incomes in Sweden have doubled while CO2 emissions have halved. Image 
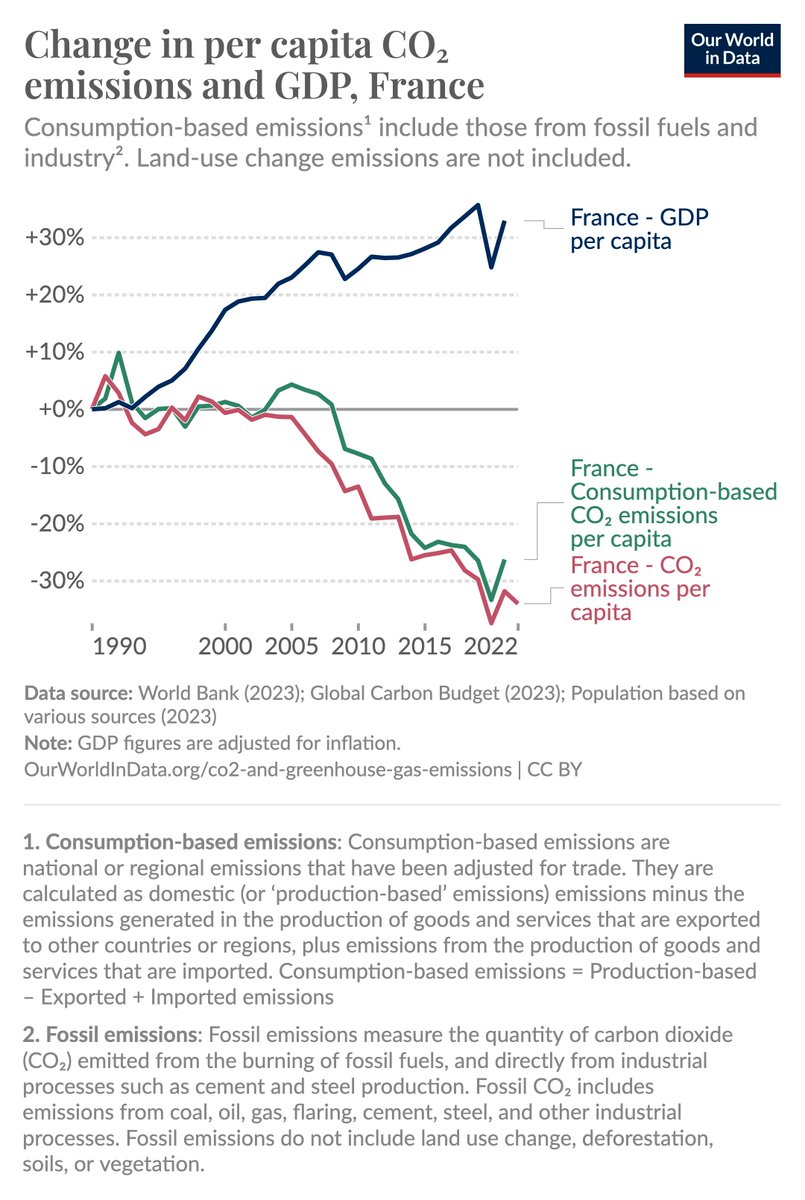
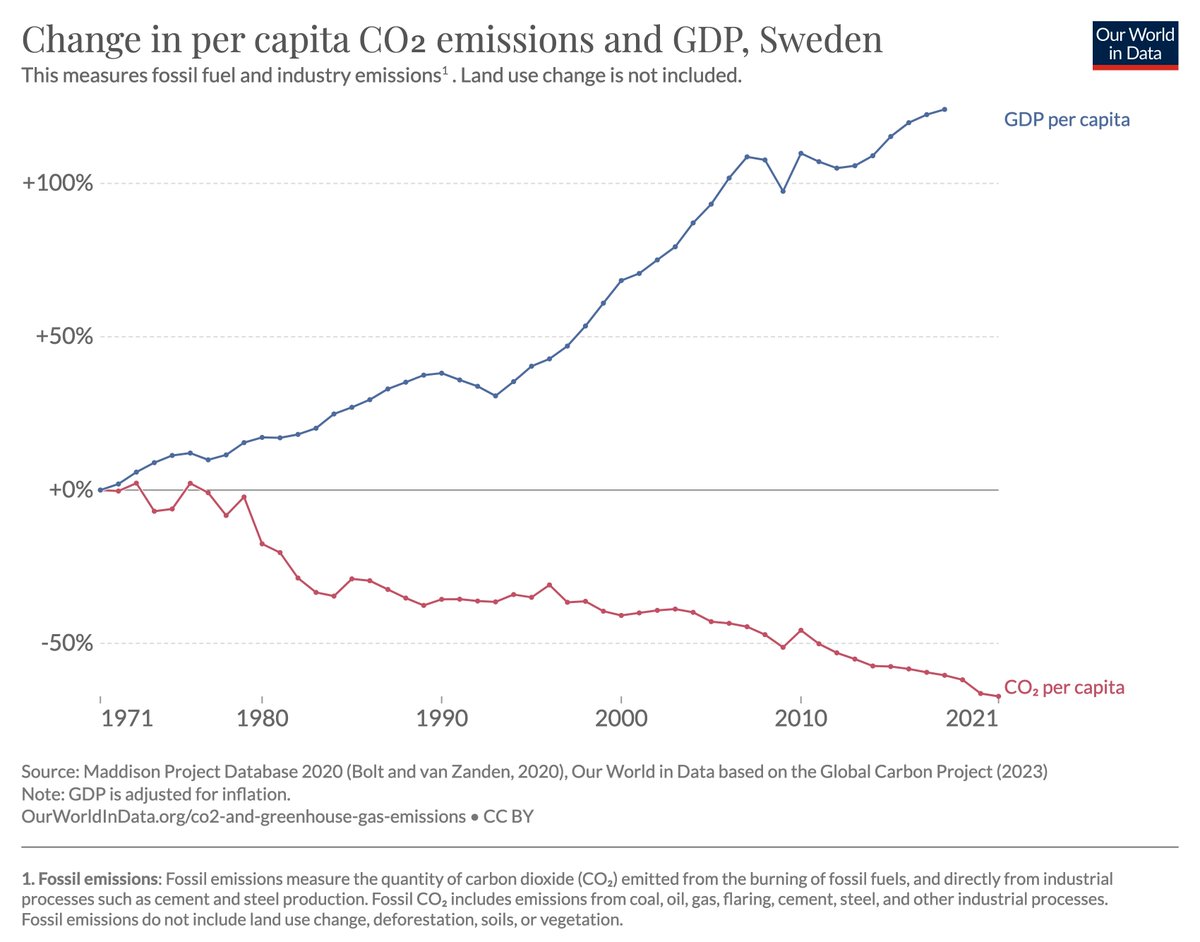
Some are commenting that economic growth is not a valuable achievement.

It depends on your values how you view growth.

I think economic growth is important, because it makes it possible for society to leave poverty behind.

👇 This shows the data for Sweden in these 5 decades. Image
Apr 27, 2023 21 tweets 4 min read
Why does powerful Artificial Intelligence pose a risk that could make all of our lives much, much worse in the coming years?

There are many good texts on question, but they are often long.

🧵I'm trying to summarize the fundamental problem in a brief Twitter thread. The fundamental reason is that there is nothing more dangerous than intelligence used for destructive purposes.
Jun 1, 2022 16 tweets 6 min read
Research suggests that many children – especially in the world’s poorest countries – learn only very little in school.
What can we do to improve this?

My new post is out ourworldindata.org/better-learning

👇 I'll write a short thread below. For many children schools do not live up to their promise.

This is a problem in rich countries.
But it tends to be a much larger problem in poorer countries, as this data from @jpazvd and colleagues shows.
Mar 15, 2022 4 tweets 2 min read
My new post is out: ourworldindata.org/longtermism
It is about humanity's past and future.

I don't know how to summarize this post in a thread. But I can share the two visuals I made for it. 👇 • Demographers estimate that 117 billion humans have been born.
• Almost 8 billion are alive now.

To bring these large numbers into perspective I made this visualization.

A giant hourglass. But instead of measuring the passage of time, it measures the passage of people. /2 Image
Mar 5, 2022 4 tweets 3 min read
I think the visualization teams in many media outlets need to rethink how they map the war.

Most do maps like the one on the left. But that is not reflecting their own reporting. There aren't entire *areas* that are 'under control'.

On the right is a more accurate alternative. 
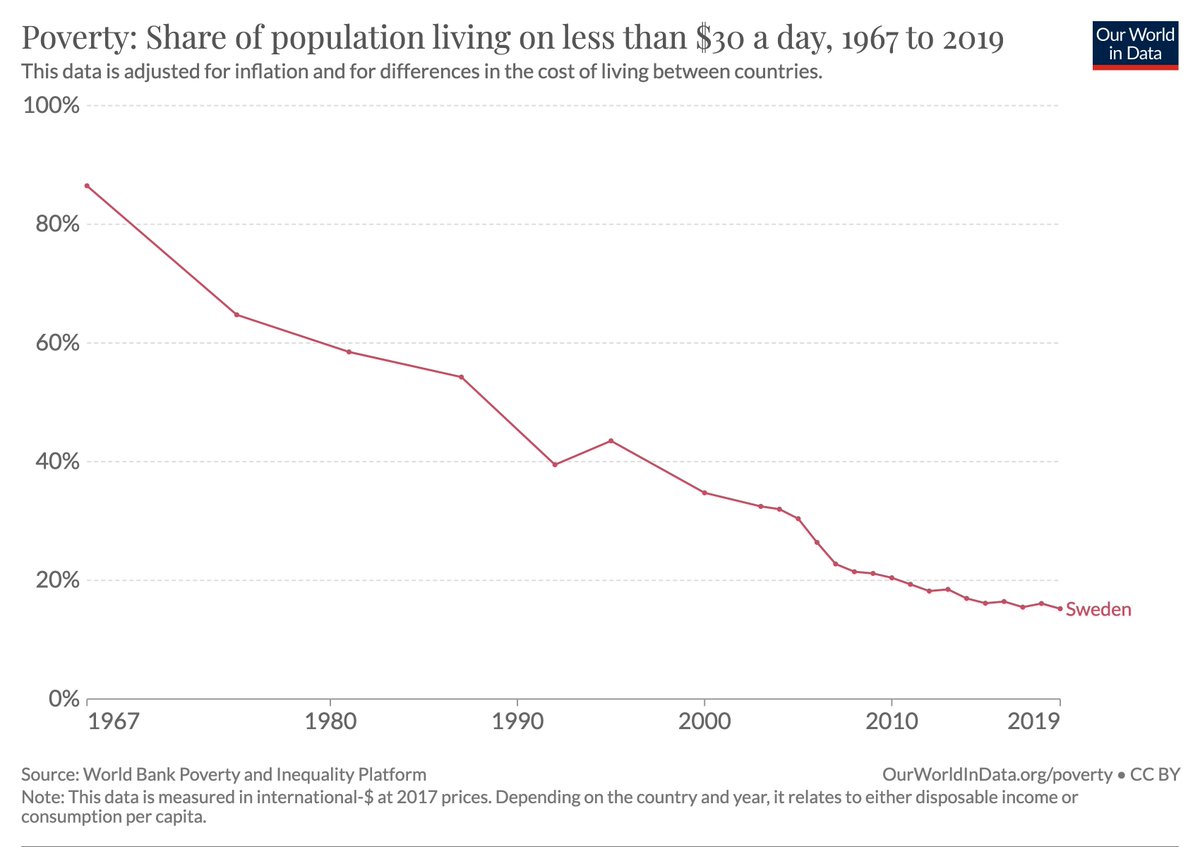
It is not just the BBC that makes such bad maps.

Below are screenshots from The Guardian, The New York Times, and The Economist from just now.

And I am not the first one to make this point. It is a well-known mistake in mapping wars.
Dec 28, 2021 6 tweets 2 min read
Confirmed COVID cases are only a fraction – in many countries a small fraction – of all cases.

That is why it is wrong to report confirmed cases as if they were all cases, as many newspapers do.

For example the Guardian:
Confirmed COVID deaths too are in many countries only a small fraction of all deaths.

That is why it is wrong to report confirmed deaths as if they were all deaths, as many newspapers do.

For example the BBC:
Dec 27, 2021 5 tweets 2 min read
The BBC writes again this morning “Nearly 5.4 million people have died with coronavirus worldwide.”

This is not true at all.

It is wrong to report the number of confirmed deaths as if it was the number of all COVID deaths. The number of all Covid deaths is certainly much, much higher than 5.4 Million.

Especially in poorer countries only a fraction of covid deaths get confirmed as covid deaths.

How much higher the true death toll is is unknown.
But there are relevant estimates.
Dec 9, 2021 13 tweets 4 min read
My new post is out: It is about the extremely large global economic inequality of our time.

My text is here
ourworldindata.org/global-economi…

👇 I'll share a thread with some of the points. This chart shows the extent of global inequality.

The top 1% live on more than $125 per day.

If you live on $30 a day you are part of the richest 15%.

The majority of the world is very poor: the poorer half of the world, almost 4 billion people, live on less than $6.70 a day. Image
Dec 9, 2021 10 tweets 3 min read
This by the @BBC is extremely wrong.

5.2 million is the number of confirmed deaths.

How many people have died is not exactly known – though there are good estimates.

It is certainly much higher than 5.2 million, as the testing and reporting in many parts of the world is low. Image 
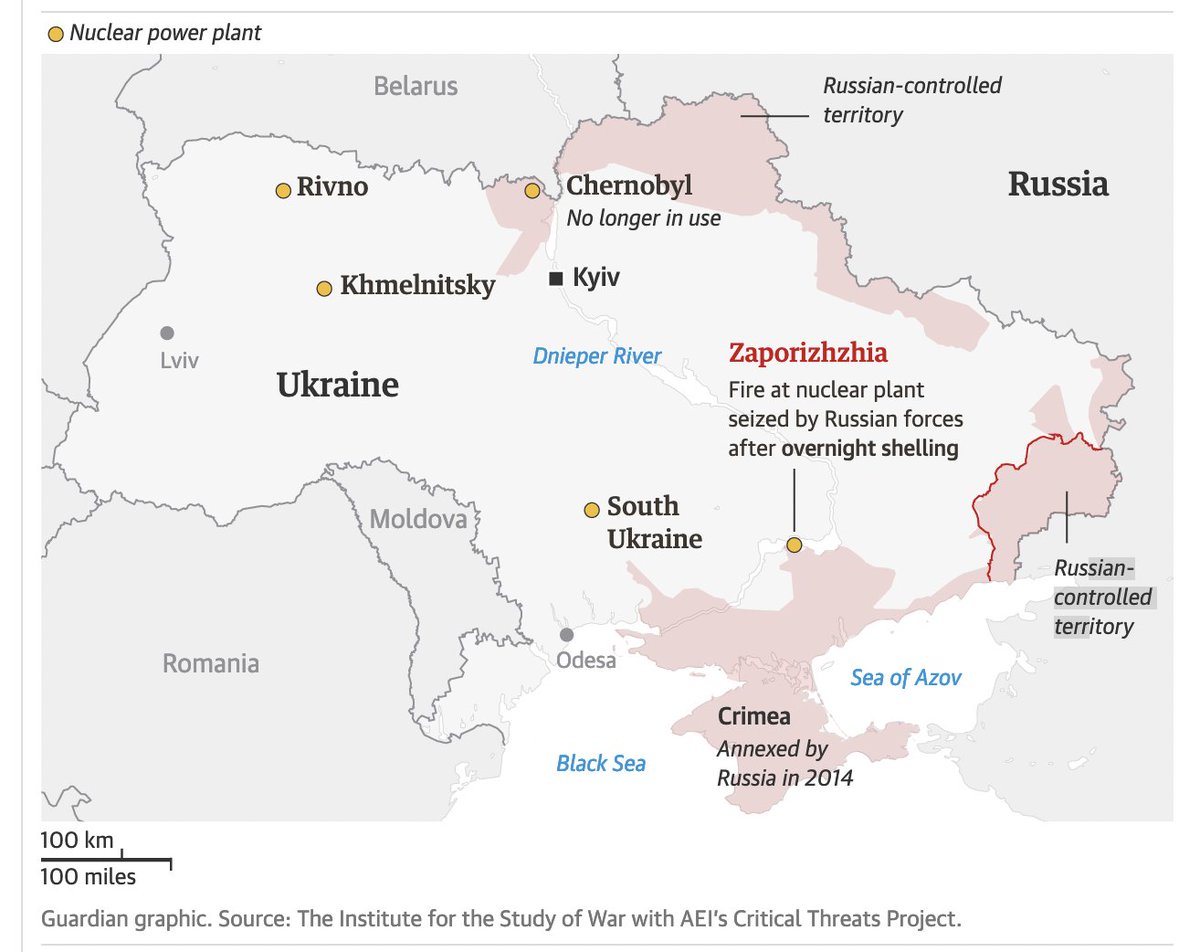
When reporting confirmed deaths it is important to communicate that.

We write in every chart that shows this measure: "confirmed deaths can be lower than the true
number of deaths."
Because that's the case. And the difference can be massive.
Dec 7, 2021 4 tweets 2 min read
People need to see what the difference between the vaccinated and unvaccinated population is.

But public health institutions in most countries fail to make this data available to their populations.

It is a scandal when it is not provided.
We should all demand to see this data. At the bottom of our article (ourworldindata.org/covid-deaths-b…) we list all sources on health outcomes by vaccination status.

Even for most of the countries for which this data is available it is often very bad: often presented in unclear ways, sometimes out of date by months.
Dec 6, 2021 5 tweets 2 min read
I am getting many messages these days from climate and energy researchers and journalists who are joining our effort to make the @IEA open access.

Now I think we will win this fight and their data will become open access. Thank you all! It will then be one of the big successes of @fbirol's era that he was the one who made the @IEA's data on climate and energy open to the public.
Nov 19, 2021 8 tweets 2 min read
1/ Poverty lines in high-income countries are drawn at about int-$ 30 per day.

I find it extremely unethical that researchers from high-income countries publish articles in which they assess whether people live in a "safe and just space" and use a poverty line of *$5.50 / day*. 
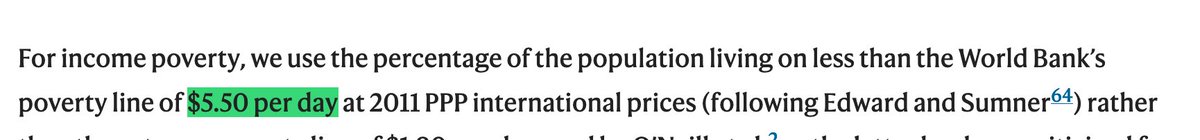
2/ These researchers are from the UK, a country where less than 1% of the population live on less than int-$5.50 per day.

Do these researchers actually believe that this is a reasonable assessment of poverty in the UK?
Nov 16, 2021 4 tweets 3 min read
The @IEA produces detailed, global energy and climate data.

But its funders – the energy ministries – force it behind paywalls.

Now @chrismatisch built a site in which you can write to your minister to ask them to make this data public.

It takes 1 minute. This is the email template.

For some countries the email template is in the country's language and addressed to the minister (as in my screenshot for the US minister).

For other countries I'm sure @chrismatisch would appreciate a translation if you speak the country's language. Image
Nov 2, 2021 4 tweets 3 min read
The first "major outcome" of #COP26 is that the politicians made the promise "to end and reverse deforestation" by 2030 and allocate $14 billion to this: bbc.com/news/science-e…

Is this realistic? Here is the long-term perspective on global deforestation:
ourworldindata.org/global-defores… Image The @OurWorldInData text I linked above is @_HannahRitchie's summary of the history of deforestation.

Deforestation peaked in the 80s and has slowed down since, but is still very large.
Oct 12, 2021 8 tweets 2 min read
Ich denke die Journalisten die ständig darauf abzielen vermeintliches Versagen in den Vordergrund zu stellen, sind Teil der Antwort warum sich nicht mehr Menschen in Deutschland impfen lassen.

Unverantwortlich jedenfalls vom Spiegel diese Schlagzeile abzudrucken.

1/n Wie weiter unten im Artikel erklärt wird, ist ein Anstieg der Impfdurchbrüche logischerweise die Konsequenz wenn mehr Menschen geimpft sind.

Der Anstieg der Impfdurchbrüche ist die Folge einer positiven Entwicklung. (Wären 100% geimpft, dann wären alle Infektionen Durchbrüche!)
Oct 9, 2021 7 tweets 3 min read
It is not 'incoherent' to rely on GDP.

GDP per capita is a measure of average income.

If you want to know several other things about our world, you can look at other measures.

[↓ a thread with some thoughts] For some reason journalists copy this lazy 'criticism' of GDP from each other.
Yes, we want to know many things, but it's nonsense to criticize one metric for not being all the other metrics.

Child mortality also doesn't tell us about environmental degradation. That's fine too.
Oct 7, 2021 5 tweets 4 min read
My new post with ⁦@_HannahRitchie⁩ is out.

We are trying to improve the situation of the @IEA.

The title is: ‘The IEA publishes the detailed, global energy data we all need, but its funders force it behind paywalls. Let’s ask them to change it.’ ourworldindata.org/iea-open-data As we explained in that post, it’s the energy ministers who are responsible. They could change it and make this data and research available to the public.

If you want to help, you can write to them and tell them that the public needs this data
Sep 10, 2021 6 tweets 5 min read
When I make data visualizations I use the software @Tableau.

It is great, though very expensive ($70 per month) – but amazingly, if you are a student, professor, or academic they make it available to you for free.

You can apply for a license here: tableau.com/community/acad… @tableau All interactive visualizations on @OurWorldInData – for example our COVID Data Explorer ourworldindata.org/coronavirus-da… – are built by us with software that we produce in our team.

We call it Our World in Data Grapher and it’s available open source here github.com/owid/
Sep 4, 2021 10 tweets 8 min read
@JKSteinberger @musta_joutsen @_HannahRitchie Hi Julia. I’ve been thinking about this paper after I read it last weekend and I I just can’t understand how you possibly wrote this paper.

I don’t understand how you ever thought it was reasonable to think of measuring human needs with a poverty line of $3.20? @JKSteinberger @musta_joutsen @_HannahRitchie It’s good to hear that you now agree that $3.20 is the “wrong” poverty line.

But the fact that you relied on this extreme poverty line in your research paper is not a minor thing in this paper. It is what is driving your main result.