
Investment manager of ASYMMETRY® Managed Portfolios for asymmetric risk/reward. Edge, trend, momentum, convexity, optionality, flows, sentiment, volatility.
 Here's the chart of short-dated U.S. treasuries with the S&P 500 overlay indicating short-term peak rates coincide with a stock market top. twitter.com/i/web/status/1…
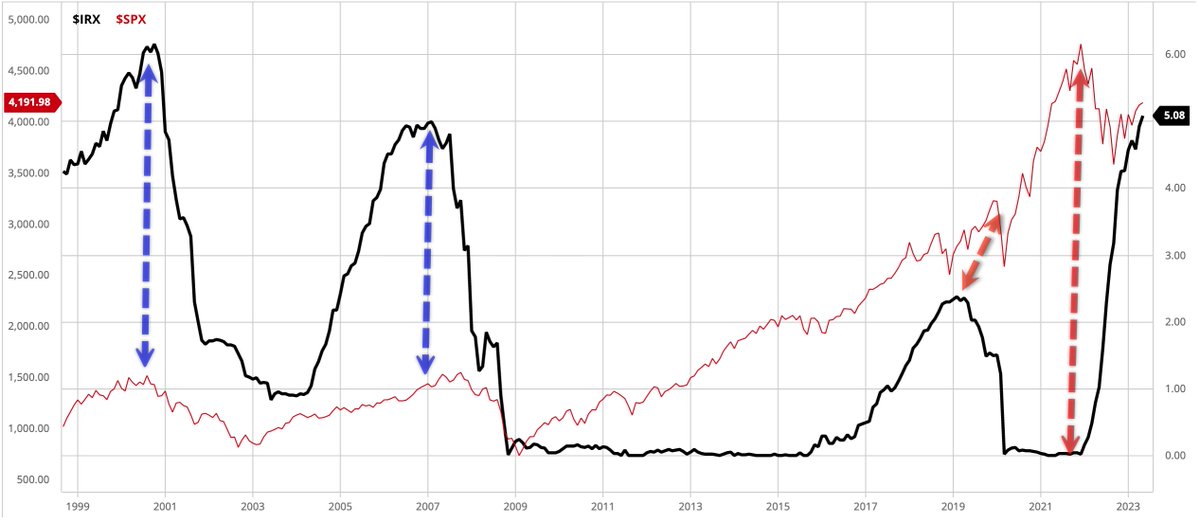
 2) but you may consider the % in an uptrend may also be used for alpha seeking asymmetric risk-reward. Ie., when only a few stocks in a sector are in uptrends, maybe instead of investing in the index ETF you'd instead invest just in those stocks.
 But when we take a look inside, and understand how it works, I see the main holdout is the . At around 22, the VIX still indicates a moderate level of FEAR, but we have to consider #VIX is fading from its highest level, ever, so its absolute level may not be as indicative.
 2) The Cboe S&P 500 5% Put Protection Index is designed to track the performance of a hypothetical strategy that holds a long position indexed to the S&P 500® Index and buys a monthly 5% out-of-the-money S&P 500 Index (SPX) put option as a hedge, and rolls on a monthly basis.
 2) Placing a channel of volatility above/below the price trend allows us to see if prices are high/low on a relative basis. By definition, the price is HIGH at the UPPER band and the price is LOW at the LOWER band. The odds are best when the price trends outside the range.
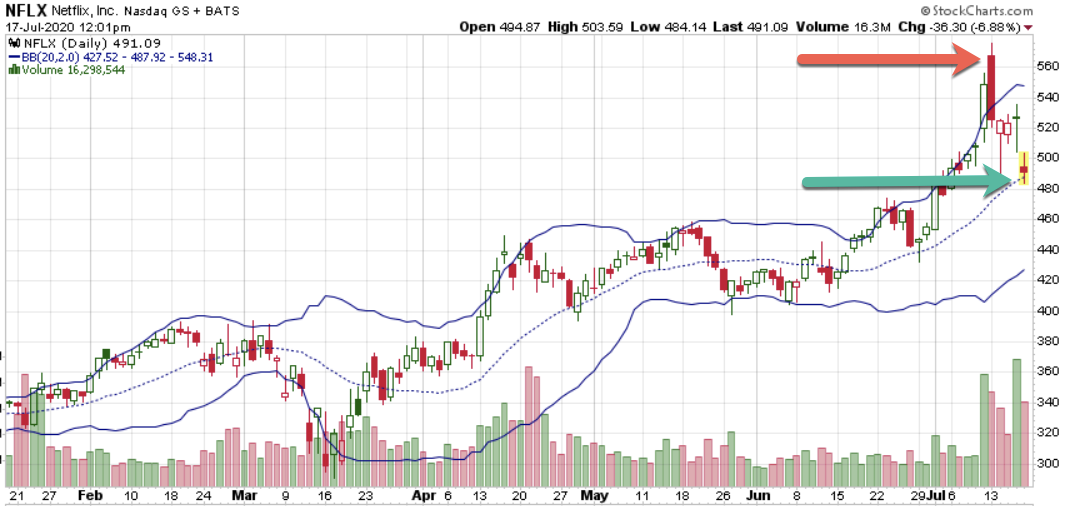
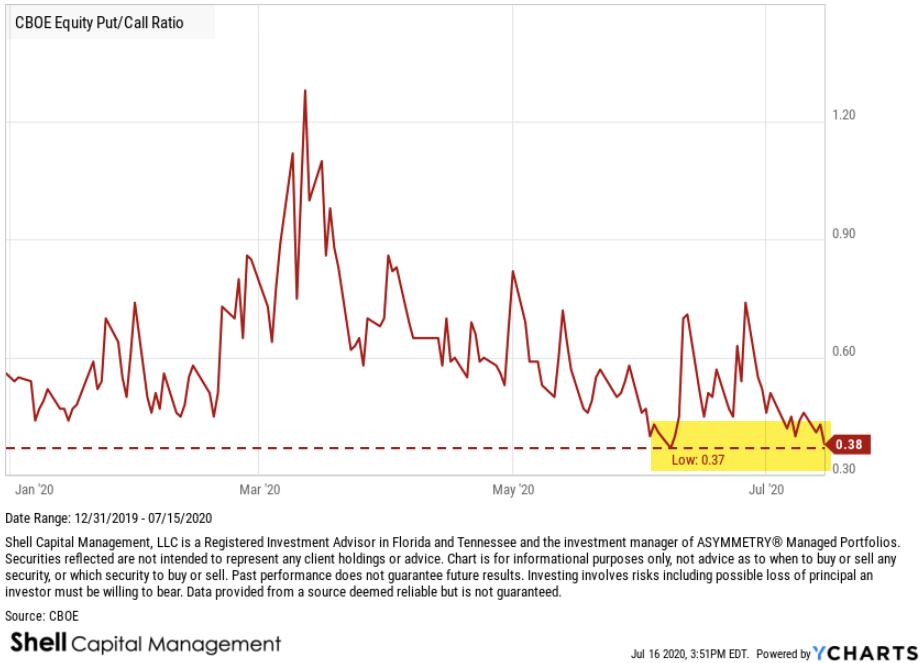 2) Yes, indeed, the CBOE Equity Put/Call Ratio reaching an extremely low level. In fact, it's as low as it has ever been going back to 2006.
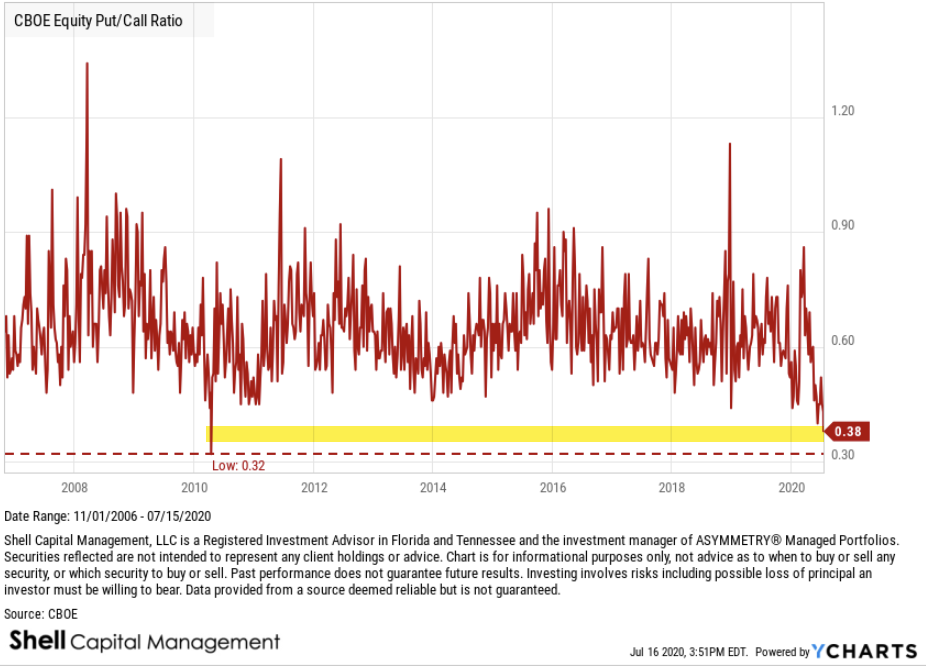
 @AndrewMcCurdy2 @jdouglaslittle different perspective:
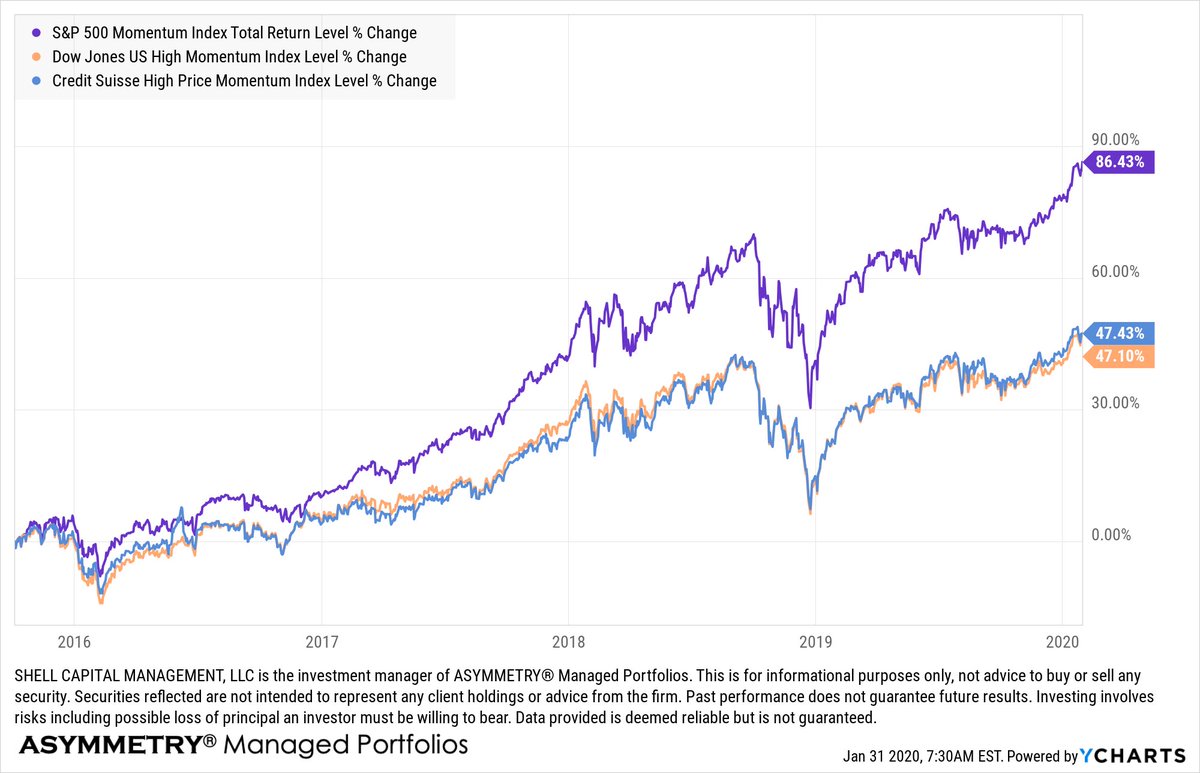 But on the downside, all three of these #Momentum momentum indexes trended together, which tells me the edge of the S&P Momentum index was in getting exposure to higher upside momentum stocks that continued their trends.
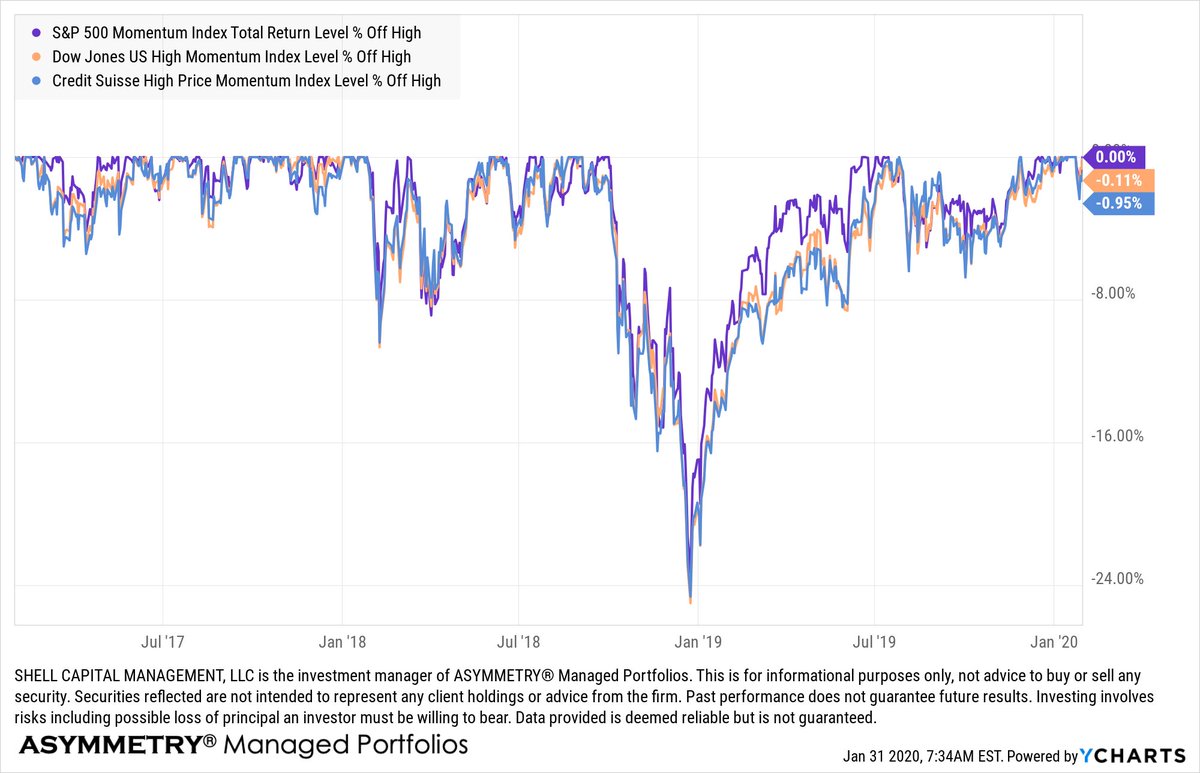
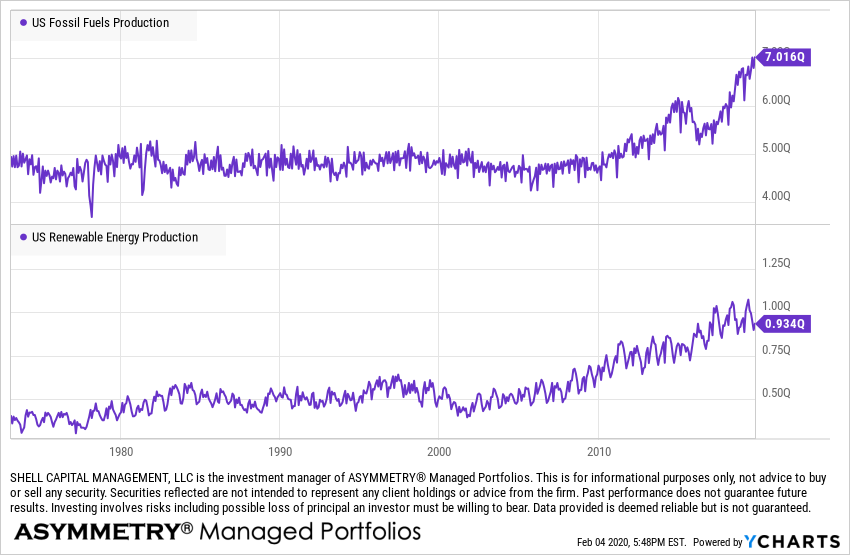
 Energy sector is -43% from its early 2014 high.
 Emerging markets have dropped the most among global stock markets. $EEM $SPY $SPX $EFA

