Head of Crime Statistics & tweets about health and life events, Public Policy Analysis @ONS All views are my own, re-tweet and like doesn't imply endorsement.
Jan 6, 2021 • 11 tweets • 4 min read
THREAD – Mortality 2020
Today we published England & Wales mortality statistics for the w/e 25 Dec
Nearly a full year’s data for 2020
In the last 52 weeks there were:
c.604k deaths registered across E&W
This is:
c.73k deaths (14%) above the 5-yr avg = excess deaths
1/11
Remember the bank holiday effect which affects weekly figs
And the lag between deaths occurring and being registered
We now provide modelled estimates of death occurrences to remove these
The chart below shows both registrations and modelled occurrences across 2020
2/11
Dec 22, 2020 • 4 tweets • 1 min read
THREAD – “The death rate from COVID is only 0.1%” – Oh no it isn’t
I won’t name and shame, but this fake stat also seems to have been sold to some people. Buyer beware
In what is starting to feel like an advent calendar of fact checking, let’s let in some light…
1/4
This one is simple
Even a basic calculation shows that the death rate must be much higher than 0.1%
With c.65k people having sadly died *from* CV across England & Wales, that would mean 65M had already caught it
There are only 60M of us here
It’s still spreading
2/4
Dec 21, 2020 • 12 tweets • 3 min read
THREAD – mortality rates
The linked thread addressed fake ONS stats that were circulating
As I made clear in the final tweet, the number of deaths is affected by population size/structure and much more
Thanks for the comments. Some thoughts on rates and context…
I co-authored it and we published in Mar, which seems a lifetime ago
2/11
Dec 19, 2020 • 6 tweets • 2 min read
THREAD – statistical misrepresentation
I have seen the table below being widely shared to falsely imply that deaths are no higher than normal this year
The table is both factually incorrect and misleading
Those who created it deliberately sow confusion and doubt
1/6
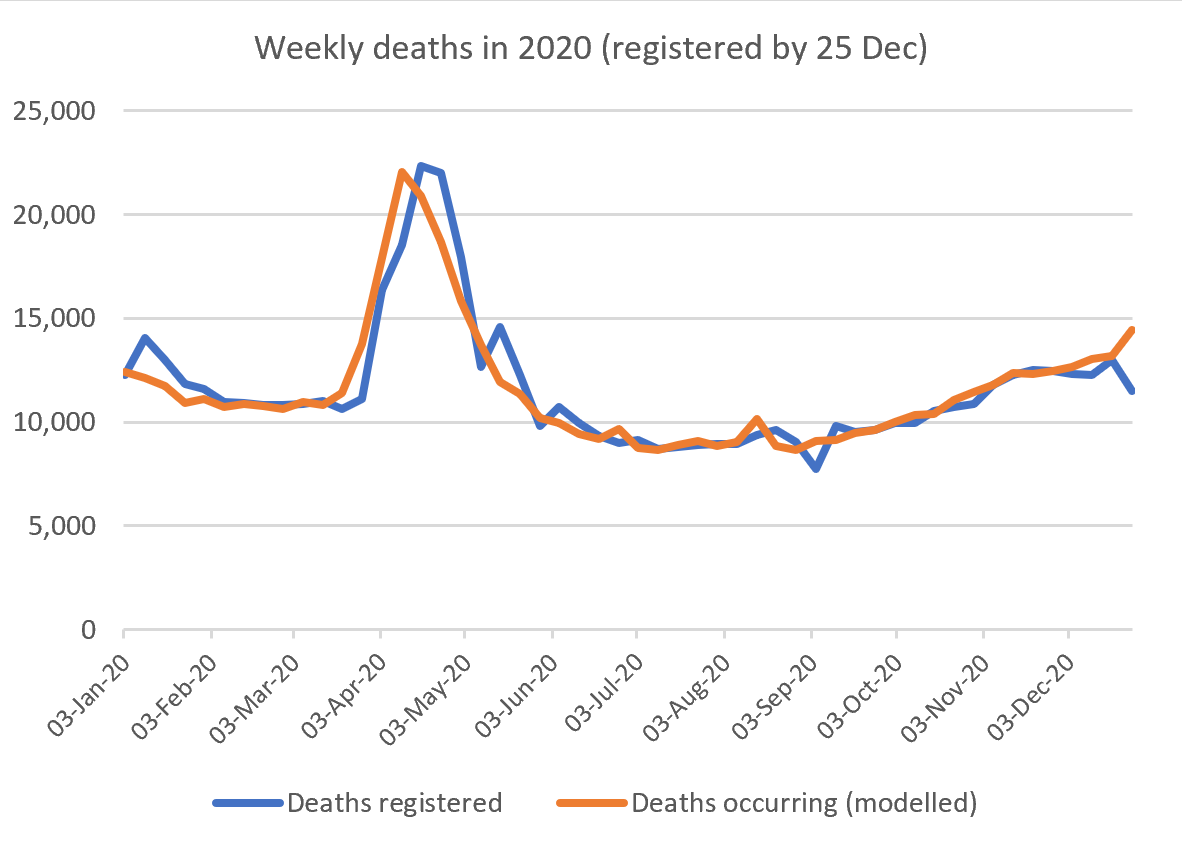
Firstly, a common approach used to manipulate statistics is the selective use of dates or time periods
In the table you can see that previous complete years are being compared to a partial year – only going up to week 45 of this year, which ended on 6 Nov
2/6
Jun 12, 2020 • 12 tweets • 4 min read
THREAD – COVID local area and deprivation analysis
Today we have updated our spatial analysis to include all deaths registered and processed so far that occurred from Mar-May
Our interactive local level MSOA map can be found here:
For both the MSOA and LA maps you can select areas, months, and whether to include all deaths that occurred or only those where COVID was mentioned on death certs
2/n
Jun 9, 2020 • 9 tweets • 3 min read
THREAD – Deaths registered w/e 29 May (E&W)
This was another bank holiday (Mon 25 May) affected week
As a result, we expected to see a reduction in the number of deaths registered. We also hoped to see a drop in the % that deaths remained above the 5-yr weekly average
1/n
There were 9,824 deaths registered, 20% fewer than the week before
This was 1,653 “excess” deaths above the 5-yr weekly average
= 20% above what we’d expect in this week of the year, down from 24% above the week before
2/n
Jun 5, 2020 • 15 tweets • 4 min read
THREAD – “Non-COVID” excess deaths
Between 7 Mar & 1 May there were 130k deaths registered across E&W
This was 46.4k deaths above 5-yr averages
According to death certs 12.9k (28%) of this “excess” did not mention COVID
98% are now fully coded enabling detailed analysis
1/n
Possible explanations include:
1. COVID was present but undiagnosed, particularly in the presence of other co-morbidities and the absence of a positive test
2. Reluctance to seek care or a delay in receiving care for people with serious health conditions
2/n
Jun 2, 2020 • 9 tweets • 2 min read
THREAD – Deaths registered w/e 22 May (E&W)
The number of death registrations last week (w/e 15/5) was high as Register Offices caught up following VE Day closures on Fri 8 May
We were subsequently hoping to see a big drop in registrations and “excess” deaths this week
1/9
12,288 deaths were registered in w/e 22 May
A drop of 2,285 (16%) deaths compared to w/e 15 May
But still 2,348 (24%) above the 5-year weekly average of 9,940 deaths
We would normally expect to see this level of weekly death registrations in the middle of winter
2/9
May 26, 2020 • 7 tweets • 2 min read
THREAD - Deaths registered w/e 15 May (E&W)
With the news agenda focused elsewhere today, here’s my summary
Caveat - where VE Day Bank Holiday register office closures reduced death regs in w/e 8 May, the subsequent catch up will have increased them in this reporting week
1/n
14,573 deaths registered - 1,916 higher than w/e 8 May and 4,385 (43%) higher than the 5-year weekly average
In the last 8 weeks 135,575 deaths have been regstd
“Excess” deaths above 5-yr av now total c.54k (E&W)
This rises to just under 60k excess deaths across the UK
2/n
May 15, 2020 • 14 tweets • 3 min read
THREAD – my first take on the COVID mortality reports we released today
1.Deaths occurring in April
2.Deaths in the care sector
Our data sources are:
-death registrations
-death notifications to CQC & CIW
1/n
The number of COVID-related deaths increased from 7% of all deaths in March to 37% of all deaths in April
Of these deaths (approx. 34k), COVID was the underlying cause of death in 95% of cases (approx. 32k)
i.e. 95% died from COVID not just with COVID
2/n
May 13, 2020 • 6 tweets • 1 min read
THREAD – Care home deaths
A number of reports today are citing a study by the LSE and claiming that official figures of deaths in care homes are seriously under-estimated
Some reports suggest that ONS have only reported 8.3k excess deaths in care homes
This is incorrect
1/n
We reported 8.3k deaths in care home settings with COVID mentioned on death certs, registered by 1 May
We also explained that this accounts for well under half of the “excess” deaths, or deaths above normal weekly averages
They total 19.9k in the last 6 weeks reported
2/n
May 7, 2020 • 8 tweets • 2 min read
THREAD - Ethnicity and COVID
What have we learnt today?
There are currently unexplained differences in the risk of being infected with and/or dying with COVID by ethnic group
1/n
We can explain approximately half of these differences by adjusting for things like age, geography, deprivation and socio-economic factors
Of these, geography is the biggest factor
2/n
May 1, 2020 • 6 tweets • 4 min read
THREAD - COVID-19 mortality mapped
We have just published deeper spatial analysis of COVID mortality and all-cause mortality from March to mid April.
This includes an interactive map of COVID deaths at MSOA level (small area statistical geography)
#COVID19#coronavirus 1/n
A local authority level interactive map of age standardised mortality rates for all-cause mortality and COVID-related mortality is also available.
THREAD - mortality by local area and geographical classification
Tomorrow we will release further analysis of all deaths and COVID-related deaths at a more granular geographical level. Full data tables will accompany this release as usual.
1/7
Counts and age standardised mortality rates (ASMRs) with confidence limits will be provided by
-region
-local authority (LA)
-deprivation deciles (England) and quintiles (Wales)
-urban/rural classification areas
-major towns and cities
2/7
Apr 8, 2020 • 14 tweets • 3 min read
Yesterday's deaths analysis - a thread.
So there I was, at 9.40 a.m. yesterday morning, sat in front of my laptop, ready to go live on the BBC News to explain the figures we'd just published, when the Skype link failed. The word "frustrating" doesn't quite do it justice.
1/n
Commentators and reporters seem to have understood things well and were soon reporting it correctly enough - a testimony to our report.
But anyway, from the data currently available, here's what I would have said.....
2/n