Smarter Cambridge Transport Profile picture
RETIRED grassroots, voluntary campaign group & think tank advancing a modern vision for sustainable, integrated and equitable transport in the Cambridge region.
Terry Barker Profile picture 1 subscribed
Oct 19, 2020 15 tweets 6 min read
The consultation on the @GreaterCambs busway between the A11 and the Cambridge Biomedical Campus is now open, and provides detailed visualisations of the scheme:
consultcambs.uk.engagementhq.com/cset-eia The fly-through provides the best impression of the scale of this project to build a new road and cycle/footway:
Aug 24, 2020 13 tweets 8 min read
The @CambsPboroCA Strategic Outline Business Case for the #A10 upgrade between Cambridge & Ely has been published:
cambridgeshirepeterborough-ca.gov.uk/about-us/progr…
@CPRECambs @ElyCycle @RailfutureEA @camcycle @TransportActio2 @Phil_Goodwin99 @xr_cambridge @cam_commons @CarbonNtrlCambs @FewsLane The analysis, by @JacobsConnects, finds Option A (full dualling with bypasses) to have the highest benefit-cost ratio (5.5) and best strategic fit. ImageImageImage
Jul 10, 2020 25 tweets 7 min read
We urge you to respond to the @CambsPboroCA consultation on the #A10 upgrade (Ely to Cambridge) before it closes on Tuesday 14th July:
a10dj.exhibition.app

Here are some thoughts to help you decide how to respond: In the context of a climate and ecological emergency, building and upgrading roads must be considered as a last resort, when all other options to increase capacity (in terms of moving more people and freight) and improve safety have been exhausted.
Nov 5, 2019 17 tweets 6 min read
In this week’s @CambridgeIndy (6 Nov), @EdwardALeigh looks back at the Mill Rd bridge closure in Cambridge to see what the traffic sensor data tells us happened after the bridge reopened. Have traffic flows reverted to how they were before the summer holidays? Let’s see … Starting at the Parkside end of Mill Rd, the most notable change is the large increase in cycles (over 1,300/day more). A pattern seen through all of these graphs is a weekly peak of car, and sometimes cycle, traffic on Fridays.
Aug 8, 2019 19 tweets 8 min read
The story so far with the Mill Road bridge closure – in 10 pretty graphs …
@smartcamb @PhilRodgers @camcycle @MillRoadSummer @MillRoadBridges @dave4labour

@VivacityLabs visual-recognition sensors are counting motor vehicles, cycles and pedestrians at 15 locations in Cambridge: 
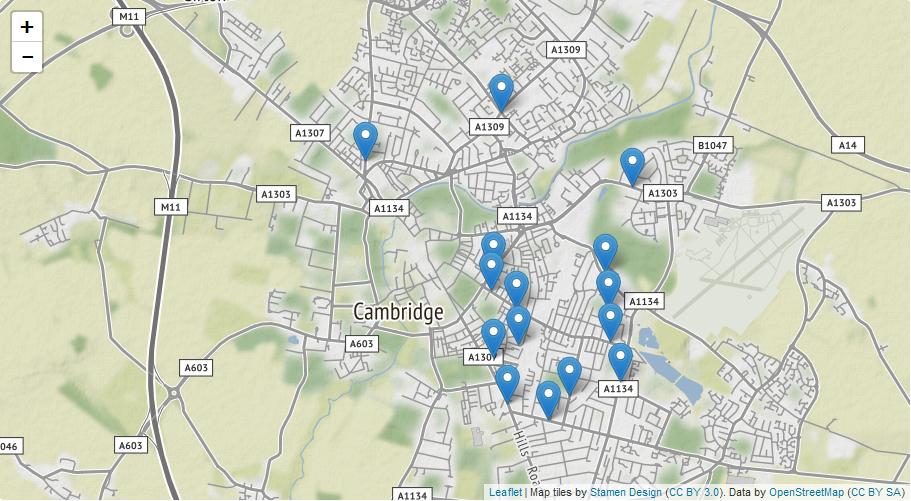
The sensors have been in place since 3 June. Mill Road bridge was closed from Monday 1 July. School term ended on 24 July. So, we’ve totalled daily counts of car and cycle traffic, and averaged over three periods: 23–30 June, 1–24 July and 25– July. Now for the graphs …