Data-driven visual content focused on global trends, investing, technology, and the economy.
📲 Creator on @VoronoiApp
2 subscribers
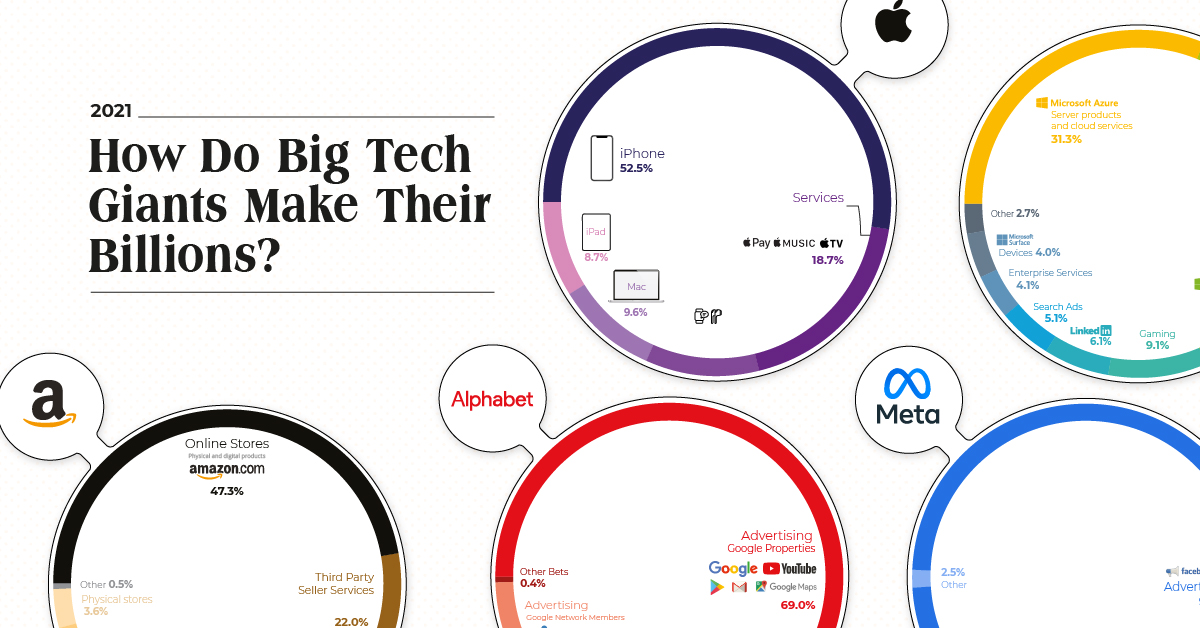
 (2/6) Apple 📱
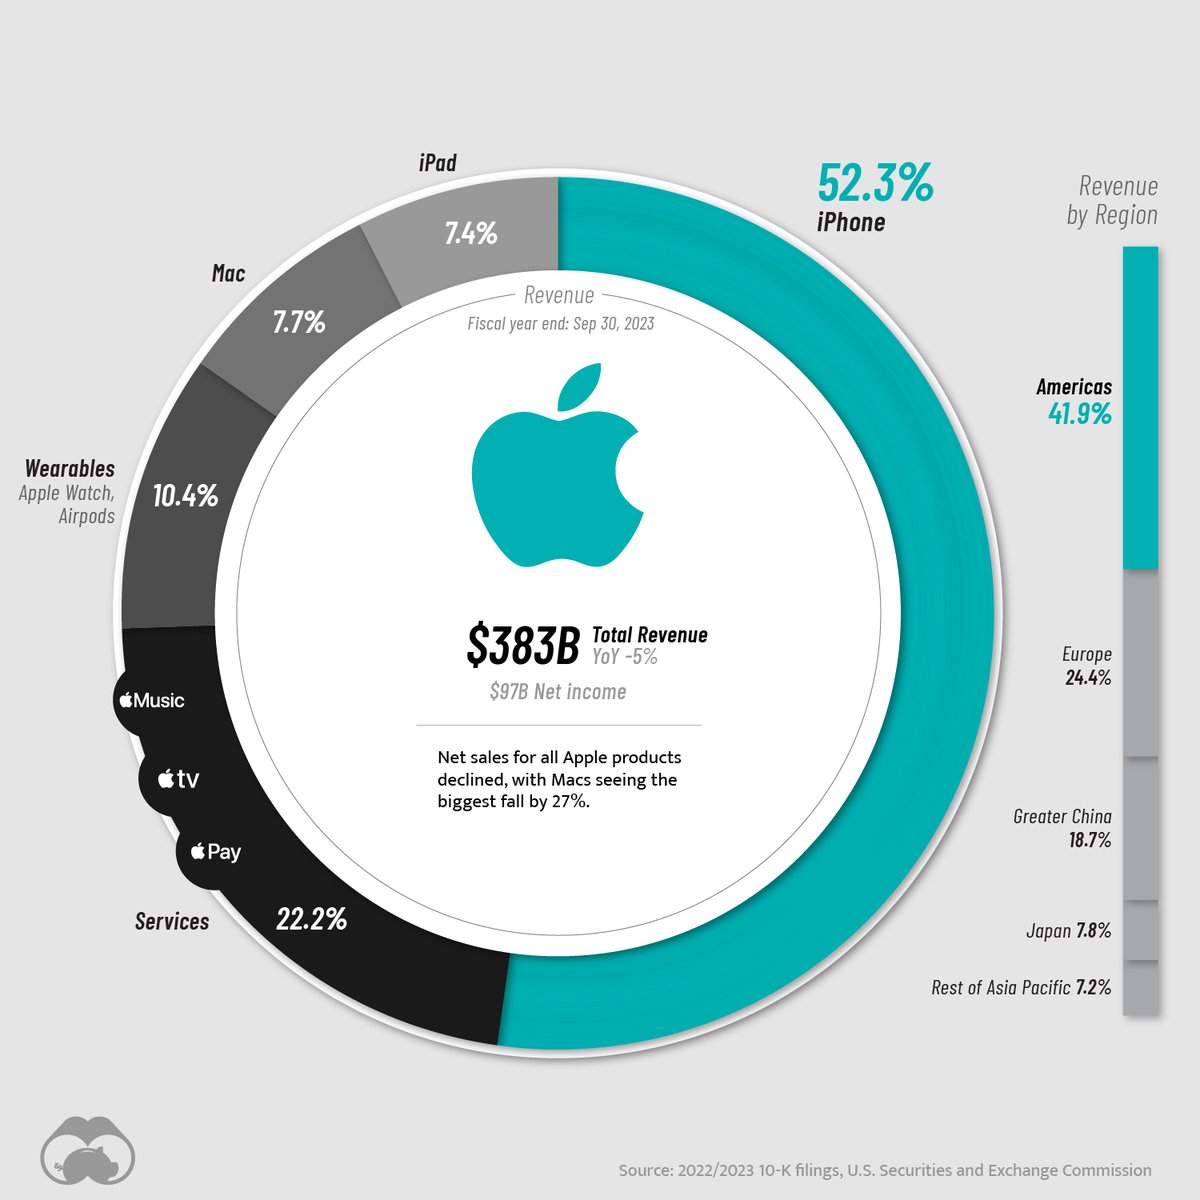
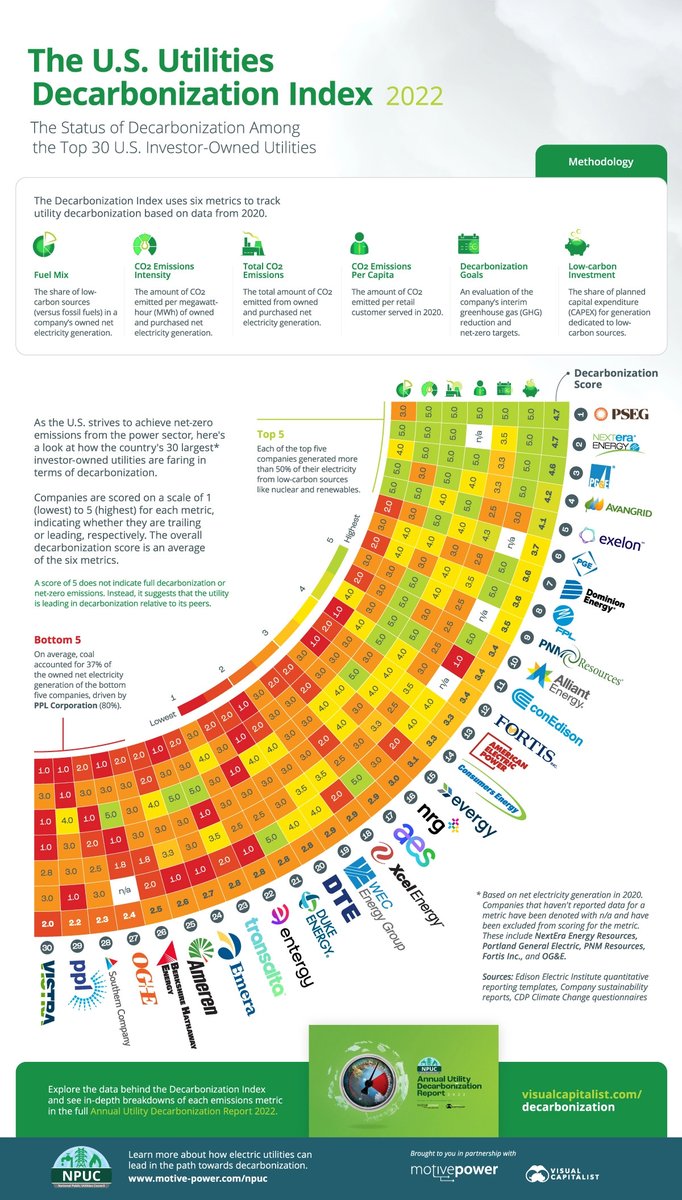 Explore the data behind the Annual Utility Decarbonization Index in the full report below
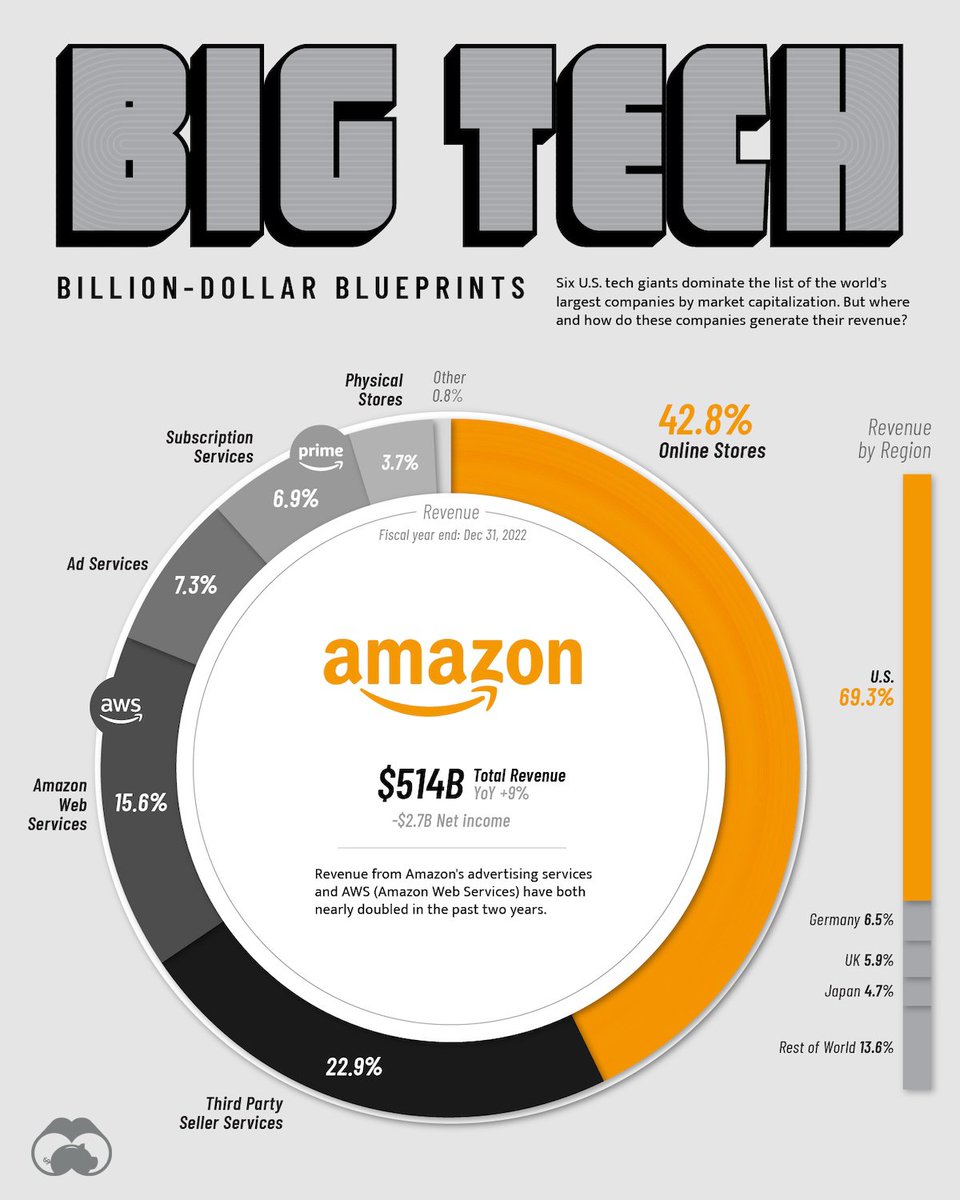
 How Big Tech Revenue and Profit Breaks Down, by Company 📊
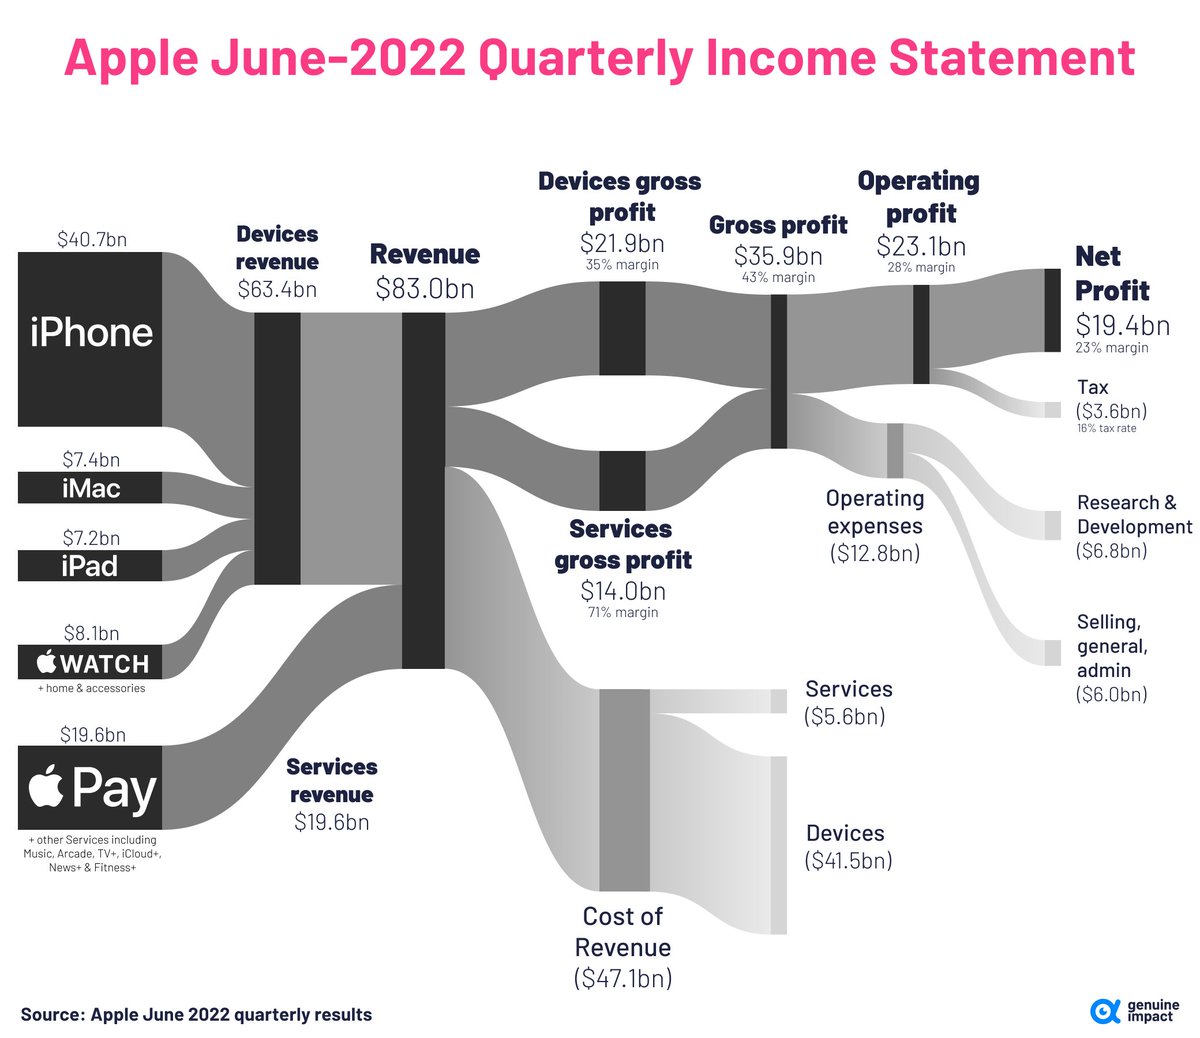
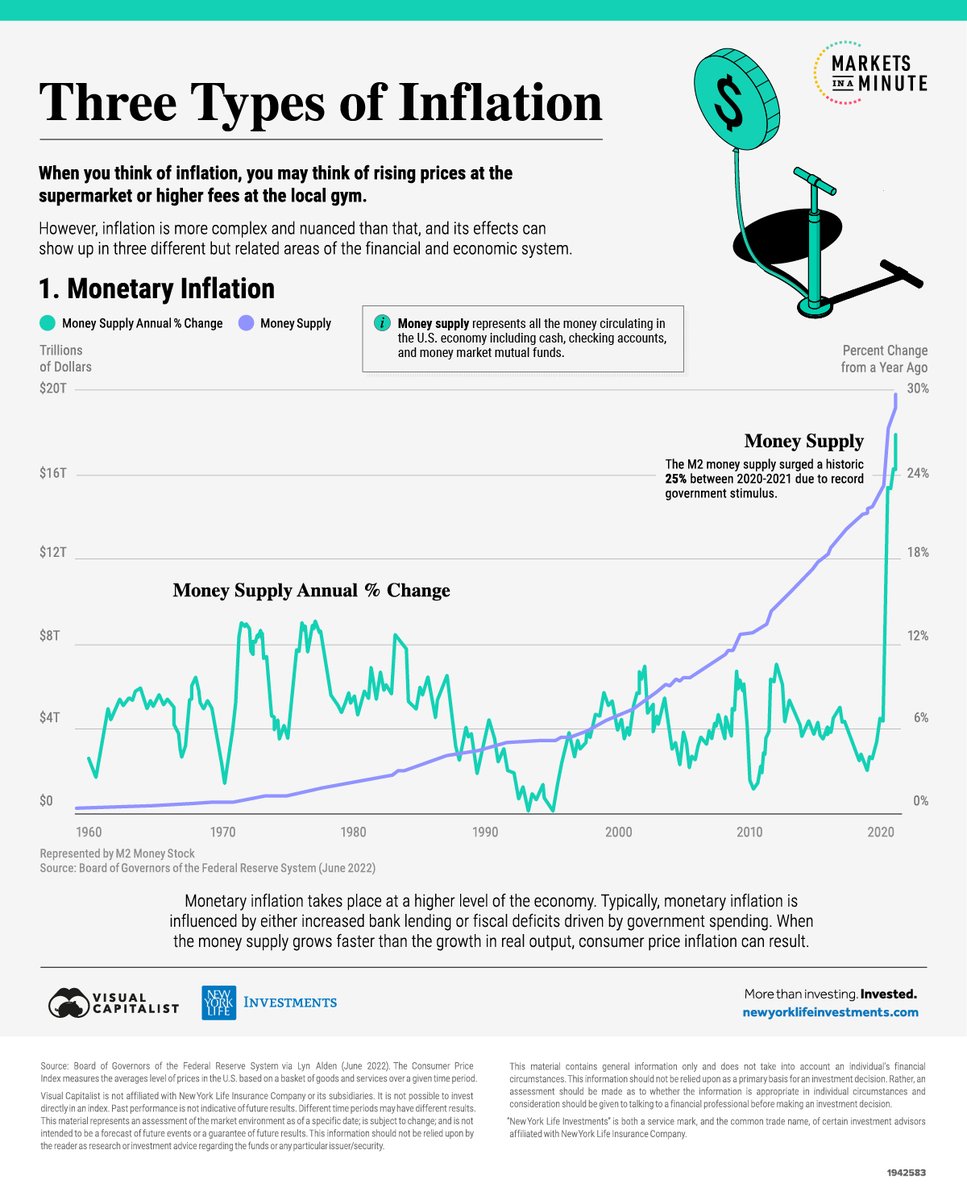 Types of Inflation
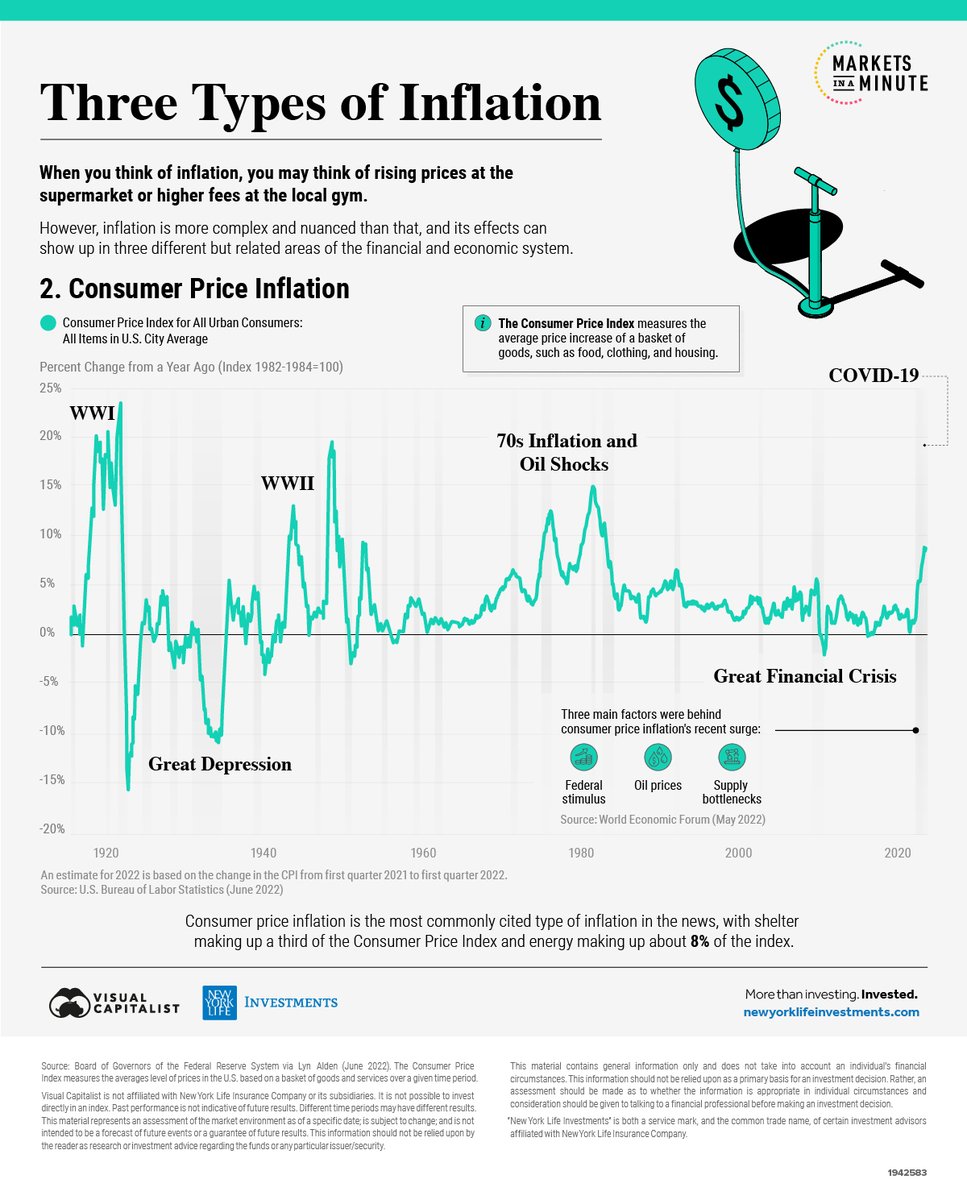
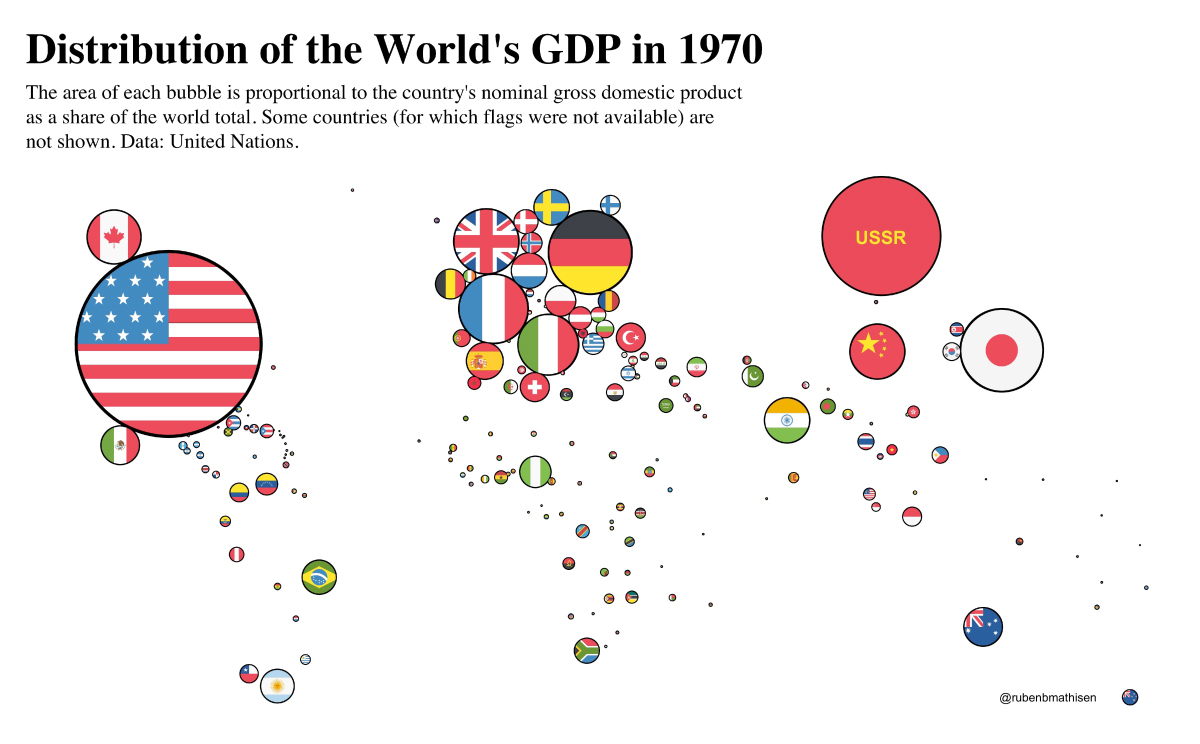 Fast forward to 1995, and Japan had emerged as the world's #2 economy.
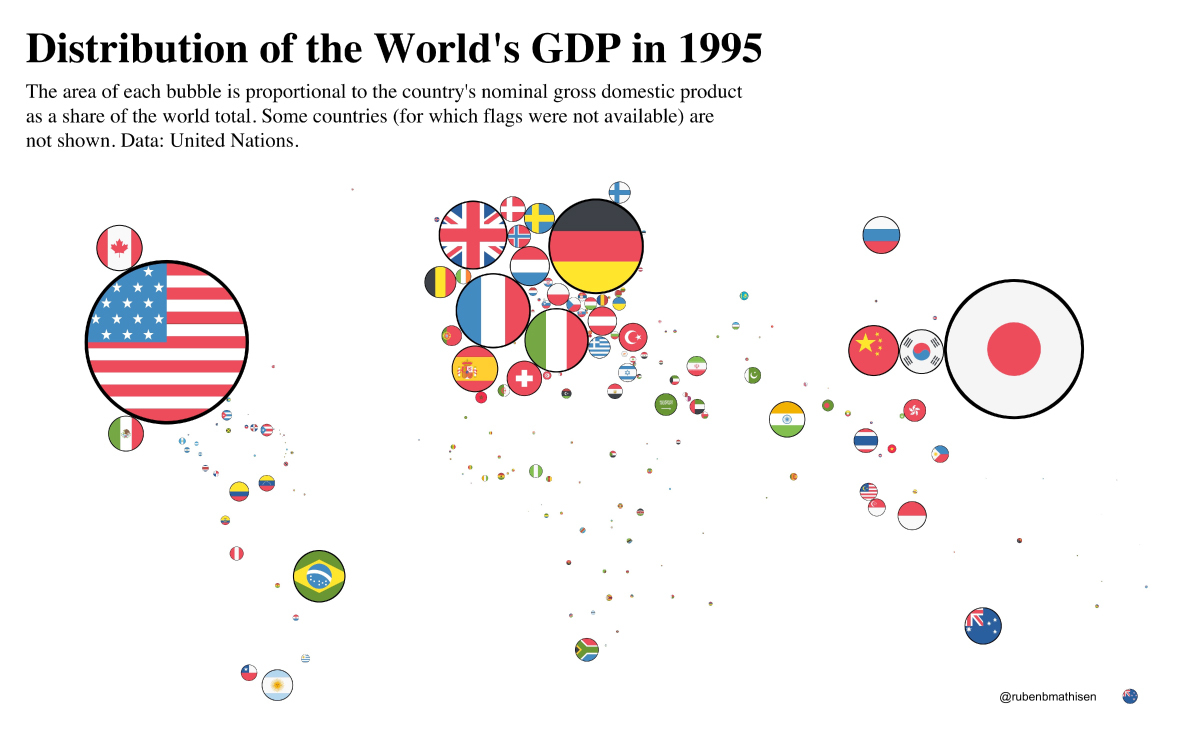
 Here's Amazon, which ranks #1 in terms of overall revenue.
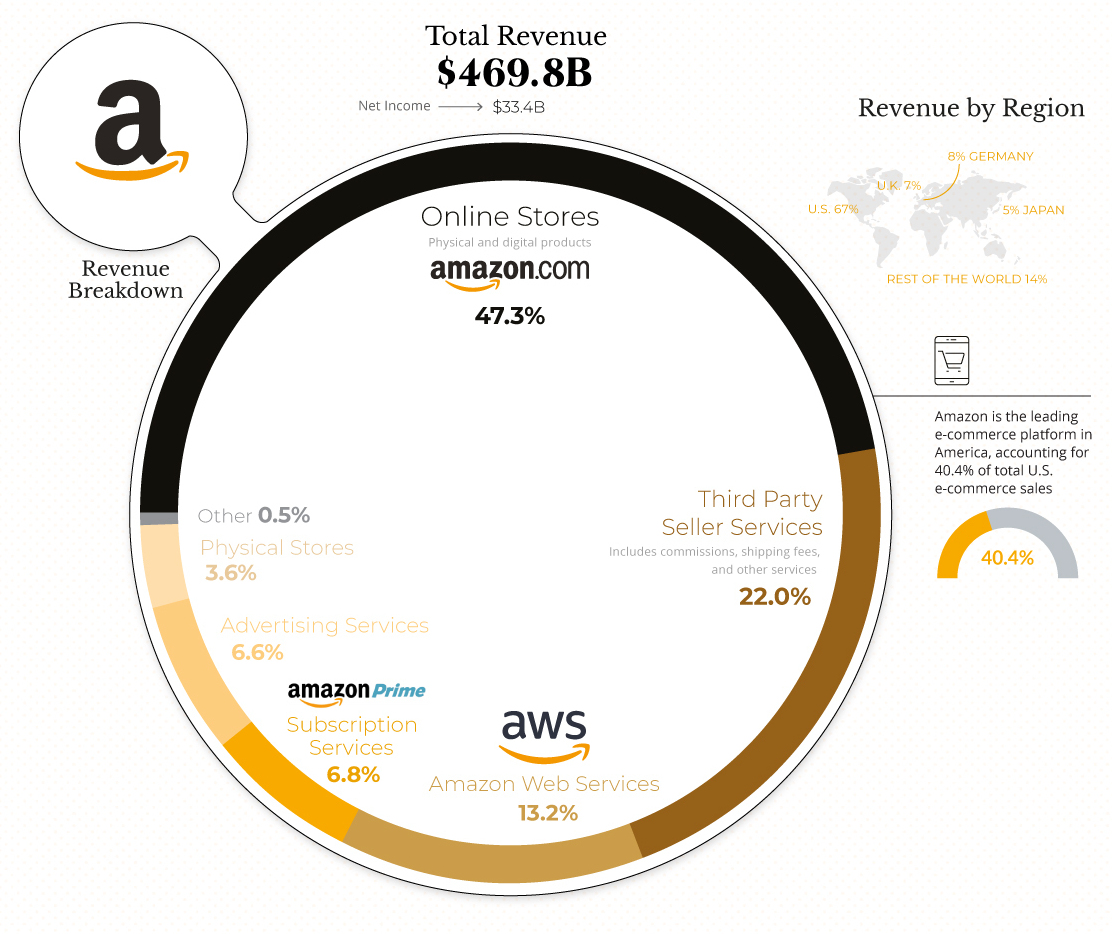
 Chart #2: The biggest struggle? Balancing personal and work life. (2/6)
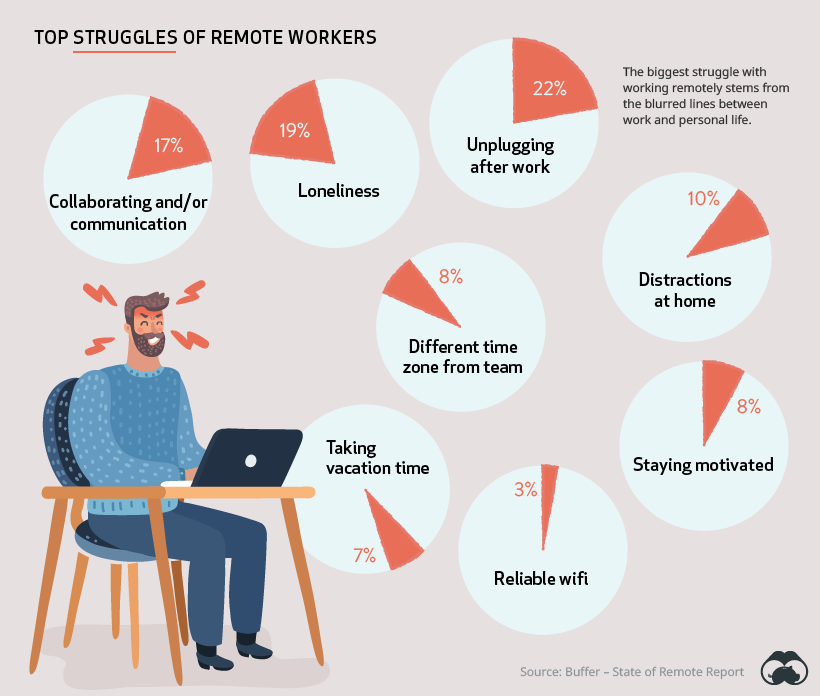
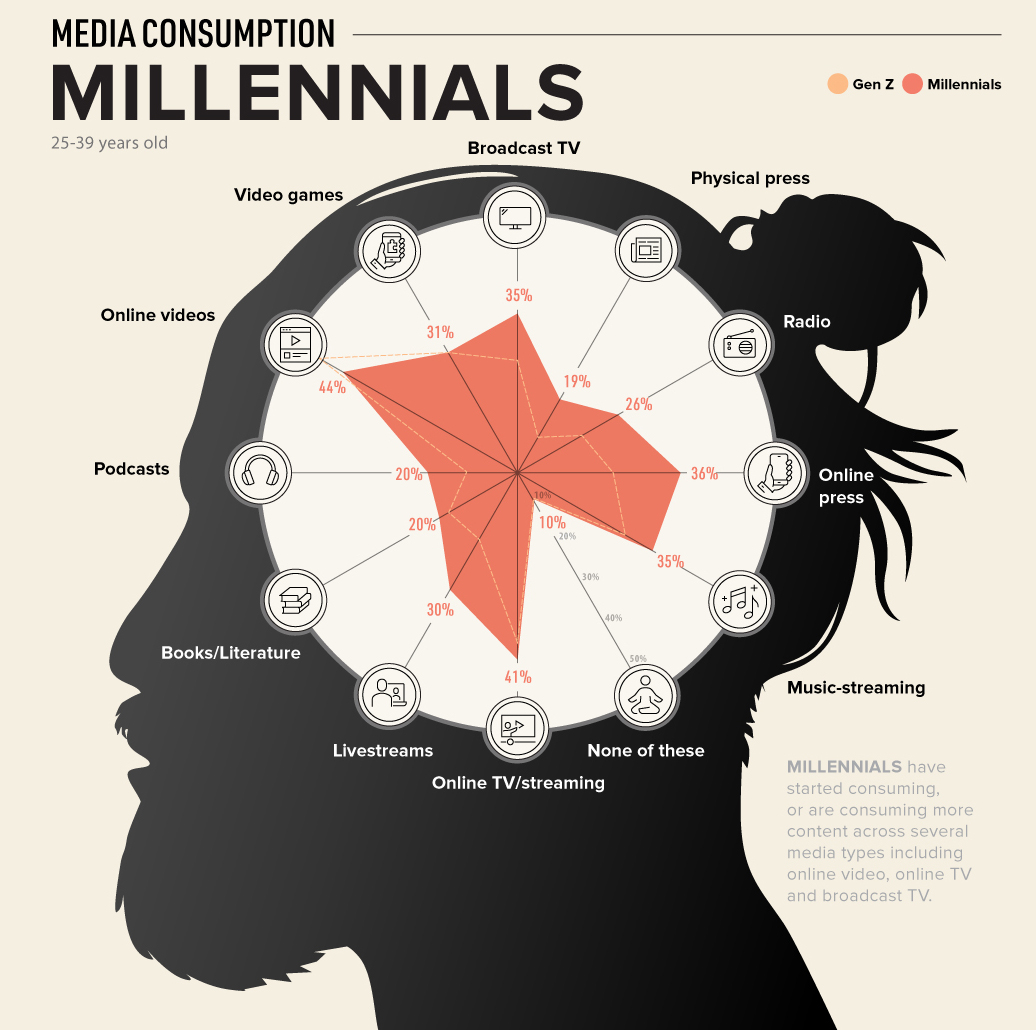
 Millennials, in comparison.