Andrew Ba Tran Profile picture
Washington Post Investigative Data Reporter
May 1, 2023 4 tweets 3 min read
My analysis found that states with stand-your-ground laws had a 55 percent higher homicide-by-firearm rate in the past two years than the states that didn’t have these laws washingtonpost.com/nation/2023/04… The perception that life is getting more dangerous has spread on the right as GOP leaders and pundits repeatedly argued, without evidence, that immigrants and protesters are jeopardizing American peace. From @jeremybmerrill Image
Sep 30, 2022 4 tweets 3 min read
I asked @tylermorganwall to try to reproduce the @washingtonpost 3D visualizations in R using the same flight data we used with #rayshader and #rayrender and boy did he deliver washingtonpost.com/graphics/2020/… ImageImage 
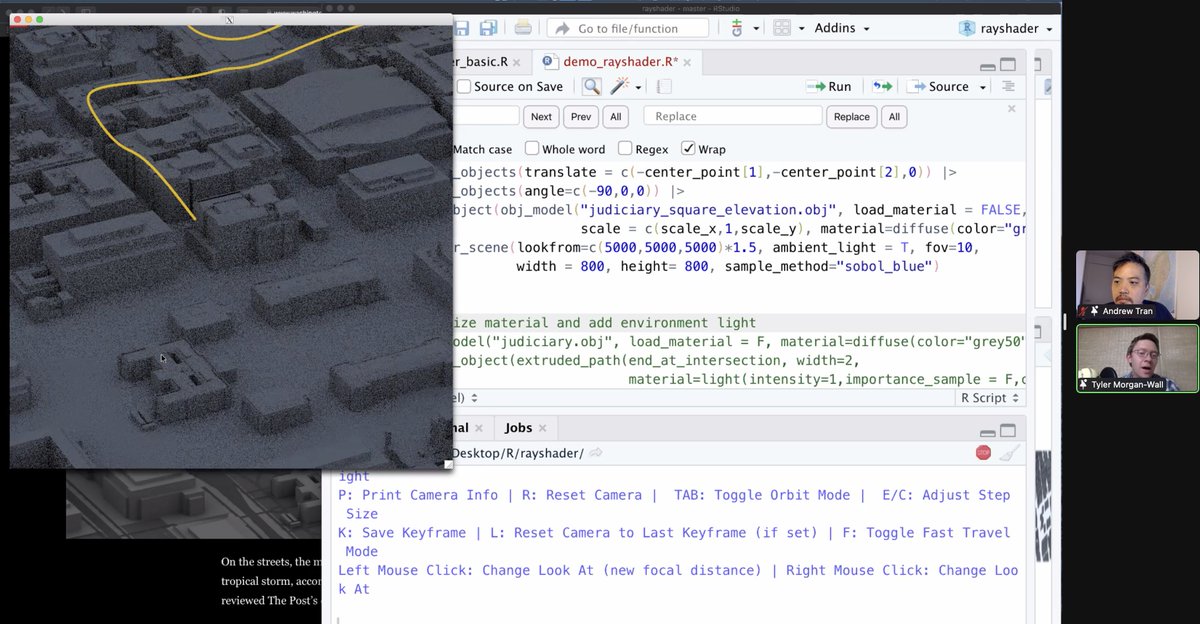
@tylermorganwall The DC building models were from openstreetmaps! And then he went and put us in the helicopter's point of view from that night going through Chinatown, passing the Portrait Museum and ending up in Judiciary Square. It reminded me of the trench run in A New Hope.
Apr 15, 2021 6 tweets 3 min read
The army finally released their report on military helicopters used to intimidate protestors in DC nearly a year later. "Be loud … fly low over the crowds” Low-level soldiers were punished for following orders but no mention of commanders who issued them. washingtonpost.com/national-secur… The report said one of the five helicopters circling DC that night “hovered under 100 feet.” When pressed, an official admitted that it was more like 55 feet. (That’s a big difference!) Here’s what I mapped from that night. ImageImage
May 30, 2020 12 tweets 6 min read
How many more people died in your state than was expected? Most of the excess deaths across the country occurred in April and March when covid-19 was peaking and before testing caught up. With @emmersbrown and @lmshap washingtonpost.com/graphics/2020/… It’s a challenge to even estimate what’s “expected” for deaths. @WeinbergerDan came up with a model that adjusts for flu, seasonality, as well as lag in reporting. The more recent the data, the more incomplete it is. See how many deaths were backfilled on April 11 over time?
Apr 27, 2020 12 tweets 7 min read
Measuring excess deaths in the U.S. and states to get a sense of the true scale and scope of the pandemic. (with @emmersbrown
@bethreinhard @LennyMBernstein @ReisThebault and @monicaulmanu and @lbronner) washingtonpost.com/investigations…? @emmersbrown @bethreinhard @LennyMBernstein @ReisThebault @monicaulmanu @lbronner We’ve partnered with @YaleSPH and @WeinbergerDan to use data modeling to examine the gap in officially reported cases and those likely coded as other diseases washingtonpost.com/pr/2020/04/27/…