Christine Zhang Profile picture
visual editing resident @nytgraphics | previously @ftdata @baltsundata @BrookingsGlobal @datagraphics | forever a friendly neighborhood data reporter 🕸
Mar 20, 2023 9 tweets 4 min read
continuing my earlier 🧵about our story , which links to @exjiang, Gregor Matvos, Tomasz Piskorski, Amit Seru’s paper estimating paper losses of $2T for banks ...

nyti.ms/3Jrs3Ej
nber.org/system/files/w…
here I will go into more detail on why the $2T figure estimated by Jiang et al is much larger than the $620B unrealized losses figure estimated the FDIC ()

[we linked to the SSRN version of the paper, it is now on NBER ]
fdic.gov/news/speeches/…
Mar 19, 2023 24 tweets 12 min read
I’m back [also, Credit Suisse news]
continuing my 🧵 Why Ppl Are Worried About Banks

26/ HTM: banks classify securities as HTM bc they’re supposed to hold them to maturity - e.g., a bank w/a $1K 10yr gov’t bond is supposed to hold it for the full 10yrs
27/ AND, if the bond’s market value goes to $750, the bank does *not* have to mark the $250 unrealized loss on its balance sheet. so the -$250 doesn’t cut into its asset values the next quarter

This paragraph by @clive_crook sums it up better
bloomberg.com/opinion/articl… Paragraph from a Bloomberg opinion column. Text reads: “Ba
Mar 19, 2023 25 tweets 11 min read
💵BANKS EXPLAINER💵
Why are people worried about banks *right now*? It comes down to *interest rate risk* — a risk all banks face, but one that hit SVB hard

🧵Diving into the DATA on bank balance sheets

By @davidenrich @KarlNYT @ellawinthrop & me
nyti.ms/3Jrs3Ej

1/ 2/ Heads up: parts of my original outline for this piece ended up in the “save it for the twitter thread” category. This is that thread.

The article itself is a lot more cogent/cohesive & any mistakes in this 🧵are 100% my own

OK, let’s start w/SVB nyti.ms/3Jrs3Ej
Sep 21, 2021 37 tweets 16 min read
NEW from @colbyLsmith & me: Now that federal unemployment benefits have expired, how is this likely to affect the labor market?

The evidence can be confusing to think through, so this 🧵lays out some aspects as clearly as I can (also read our story!)
ft.com/content/d13b20… First, on a *macro* level: in May, some states began to announce they would end unemployment insurance (UI) benefits early in hopes of boosting job growth. By midsummer 26 states ended some or all federal UI benefits. Some have called this a kind of "natural experiment" bc ...
Jun 30, 2021 6 tweets 4 min read
⚡️The @FT has partnered with @ChicagoBooth's Initiative on Global Markets to survey 50+ economists this year about macro issues such as inflation, growth & unemployment

🧵Takeaways from the 1st one, conducted Jun 25-28 ft.com/content/de778e… via @colbyLsmith @brookefox91 & me A majority of those surveyed said it was extremely likely (>75% chance) there would be at least 2 interest rate hikes by the end of 2023

This aligns with Fed officials' "dot plot" projections from earlier this month (see ft.com/content/56ce9f… by @JamesPoliti @colbyLsmith) Strip plot showing economist's projections for rate hikes by
May 28, 2021 28 tweets 15 min read
NEW: @Claire_Bushey & I analyzed allegations of police misconduct from three US cities (Chicago, NYC, Philly), and I have organized the #rstats DATA+CODE in a GitHub repo ⚡️⚡️⚡️

github.com/Financial-Time…

The @FT STORY:
ft.com/content/141182…

*THREAD* about the data 1/ To begin, here's an old-school chart from the Christopher Commission's independent investigation of the LAPD in 1991, after the police beating of Rodney King

The report found that the top 10% of officers w/misconduct complaints against them accounted for 28% of ALL complaints A chart from the Christopher Commission 1991 report showing
Feb 20, 2021 19 tweets 11 min read
NEW from @Claire_Bushey & me:

In cities/metros across the US, the areas most affected by the pandemic are often the slowest to be vaccinated, reflecting long-standing patterns of segregation

We spent weeks gathering the data from 5 of them

Story:
ft.com/content/7b0db8… Our story begins in Chicago, one of the most segregated cities in the US.

HT @ChiVaxBot and @WF_Parker who have been regularly tracking these disparities & whose work partly inspired us to do our own digging into other localities

Maps of Chicago, Illinois, ...
Nov 16, 2020 23 tweets 12 min read
NEW: #Election2020 turnout is the highest in over a century, but who's gotten the most votes, and where? We looked at precinct & county data in key areas to find out: [THREAD]

By @jburnmurdoch & me — our second @FT collab in two weeks! ⚡️

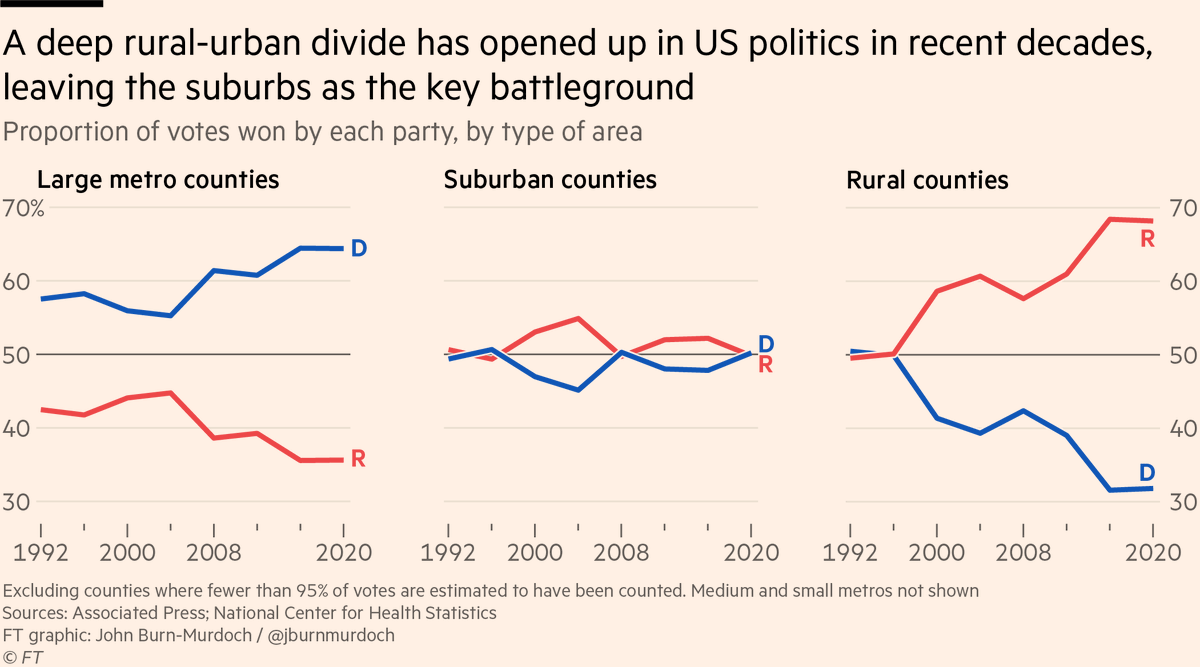
ft.com/content/31a027… 1/ Much of the story's in the suburbs, which Biden "won back" to a certain extent. Meanwhile, a red rural wave has countered the suburban swing.

Result: an increasingly polarized US.
Nov 7, 2020 25 tweets 14 min read
HOW DID AMERICANS VOTE/SHIFT FROM 2016? It's tempting to just compare 2020 exit polls to 16's to unpack voting patterns, but that's problematic.

Our @FT story explains why & uses exits AND other sources to paint a preliminary picture of trends: (THREAD)

ft.com/content/69f320… 0/ TLDR: Here's our summary #dataviz that shows the shifts, because my time in journalism has taught me not to bury the lede 🤓

But hey, it's my twitter thread so I'm gonna answer the "How did you get these numbers?" Qs that @jburnmurdoch & I grappled with *A LOT*
Sep 4, 2020 13 tweets 9 min read
POLLS EXPLAINER: it's natural to want to compare 2020 election polls to 2016's, especially in swing states, but here's why that might not be such a good idea. My story in the @FT today reviews the key differences: (THREAD)

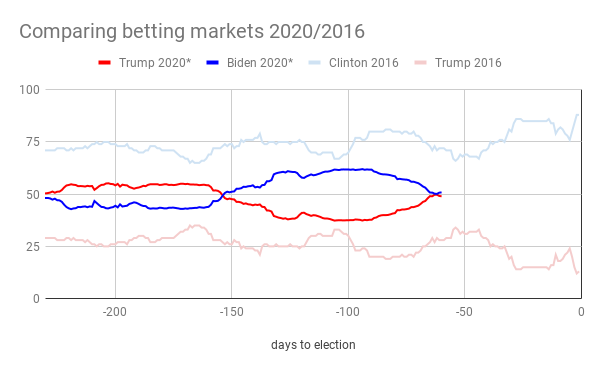
ft.com/content/b32976… 1/ there's a lot of talk abt Trump/Biden betting odds being at 50:50, but here's a chart via @martinstabe showing in 2016, betting mkts were confident Clinton would win. in surveys more ppl including Trump voters also said they thought Clinton would win ft.com/content/3c9487…