Paul C of 🏴󠁧󠁢󠁥󠁮󠁧󠁿 i 🇸🇪 Profile picture
Pandemic stats, Everton, running - all opinions my own etc. Dad/Bloke/Gubbe
Jehosephat Trimbleshank Profile picture 2 subscribed
Apr 15 5 tweets 2 min read
Of the major countries with complete and quality data for 2023, only 5 have seen an *improvement* in mortality rate for the Pandemic period 2020-23 compared to the previous 4 years.....

Australia, New Zealand, Denmark, Sweden and Norway.

1/ Image 
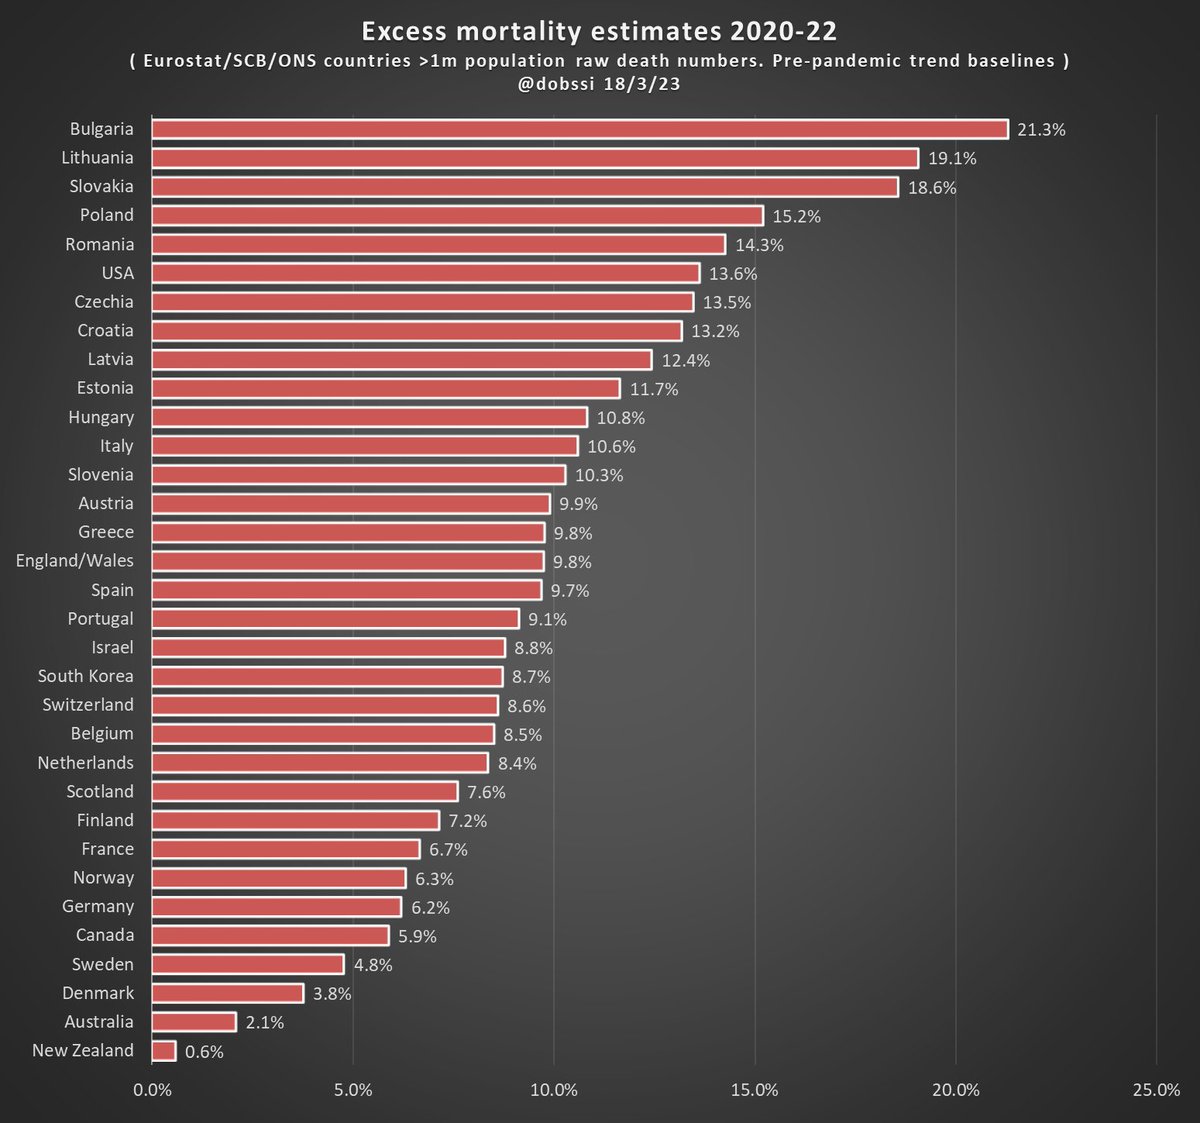
The two worst results here among Western countries are England/Wales ( -6.4% ), and USA ( -10.4% ). This likely reflects not just pandemic issues but also issues that predate it, such as healthcare and dietary issues.

2/
Feb 18 17 tweets 10 min read
I now have @CDC, @ONS and @EU_Eurostat mortality data to end of 2023.

Plus new 2023 denominators for @EU_Eurostat covering nations and major regions/cities.

Plus new data for Swedish deaths with unknown week.

2020-23 ASMR excess and YLL estimates thread for Europe and USA:

1/

Image
Image
Image
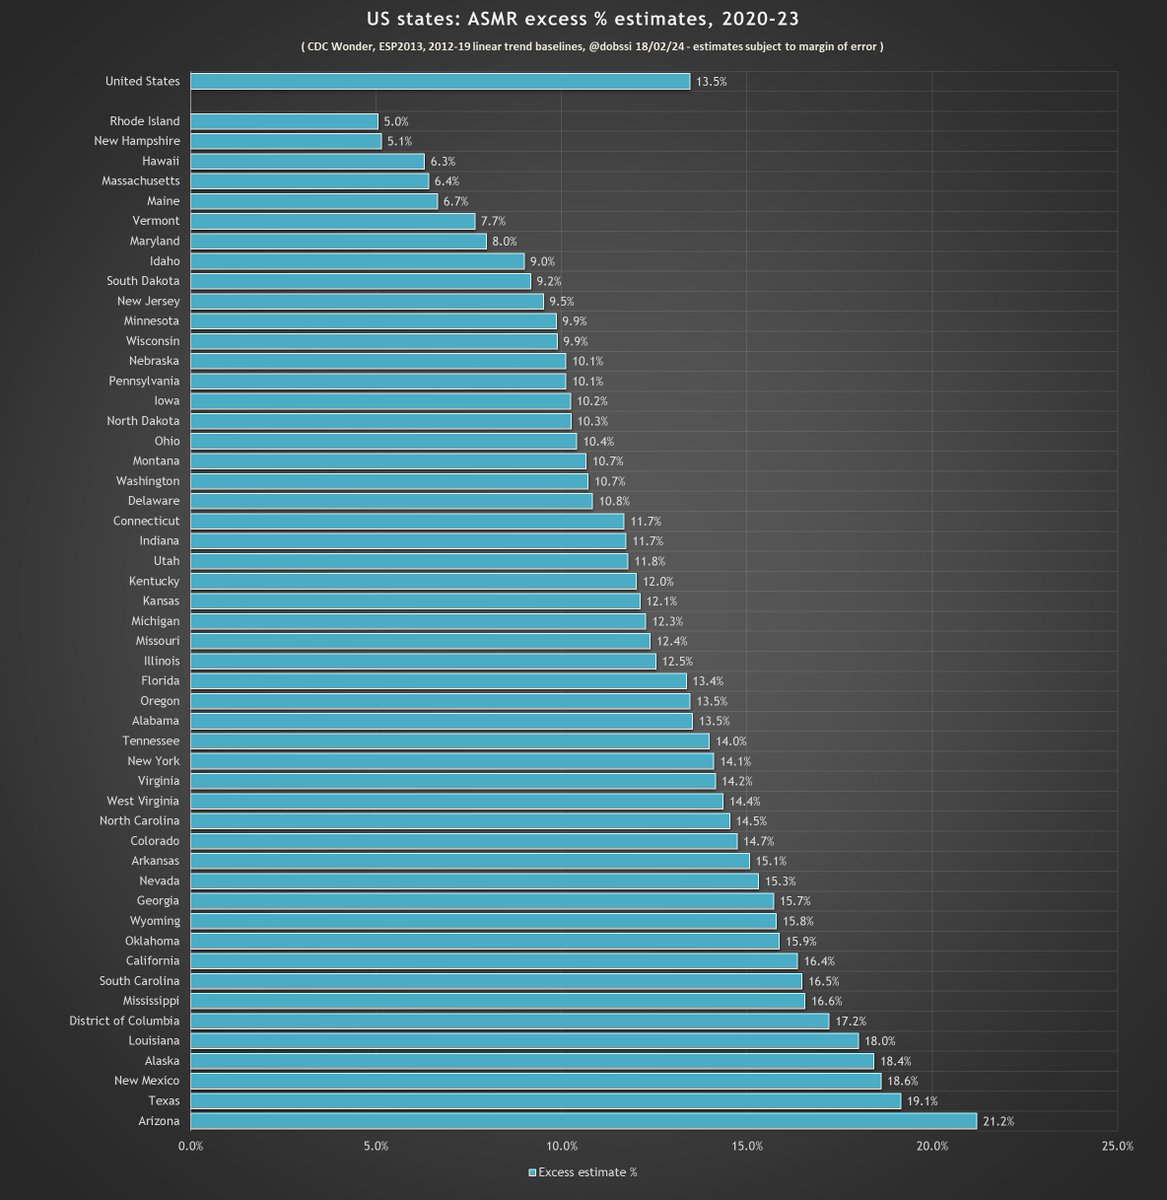
United States Age Standardised Mortality excess estimates 2020-23:

Each year's estimate shown in brackets....

2/
Image
Image
Dec 18, 2023 15 tweets 10 min read
There are various ways to estimate pandemic impact; ASMR and Life Expectancy are gold standard, with various other excess estimates out there.

One that has gone under the radar, yet is simple to calculate an estimate for is YLL - Years of Life Lost.


1/ who.int/data/gho/indic…


Image
Image
All one needs is age stratified deaths data going back enough years to make a decent baseline. 5 or 10 year bands is sufficient for a decent estimate.

We then multiply each death total according to something broadly resembling 100-age_at_death, and sum the total per year.

2/ Image
Oct 14, 2023 22 tweets 14 min read
Following on from my Sweden "post-pandemic data" thread, some further data to address the theory that vaccines are driving excess deaths since 2021.

This thread will look at 5 age groups.

TLDR 🇸🇪data shows no such signal, and indeed no virus damage signal in younger adults.

1/

Image
Image
Here is the vaccination data for the 5 age groups. Note that dose 6 data is not included, as its only available for Stockholm region, to my knowledge.

I have managed to piece together these rates from various sources - ECDC, Folkhälomyndigheten and .

2/ pathogens.se

Image
Image
Sep 14, 2023 14 tweets 11 min read
Debunk of some scaremongering by you know who.

#Sweden respiratory hospital admissions including #COVID19

Simply following the data.....

1/


Image
Image
Image
Here for various age groups are admissions with either covid19 or another respiratory disease as main diagnosis, monthly from January 2012 to May 2023.

Can you spot a signal for what Eric is claiming?

No, neither can I.

0-17, 18-29 and 30-44 first.

2/

Image
Image
Image
Aug 31, 2023 14 tweets 7 min read
As the vaccine debate rages on I think its worth documenting the periods where the data for Sweden really does suggest they worked, especially in 2021 for the Alpha and Delta waves.

Focus is on elderly here, as Sweden's working age population had no obvious excess deaths.

1/ Image 
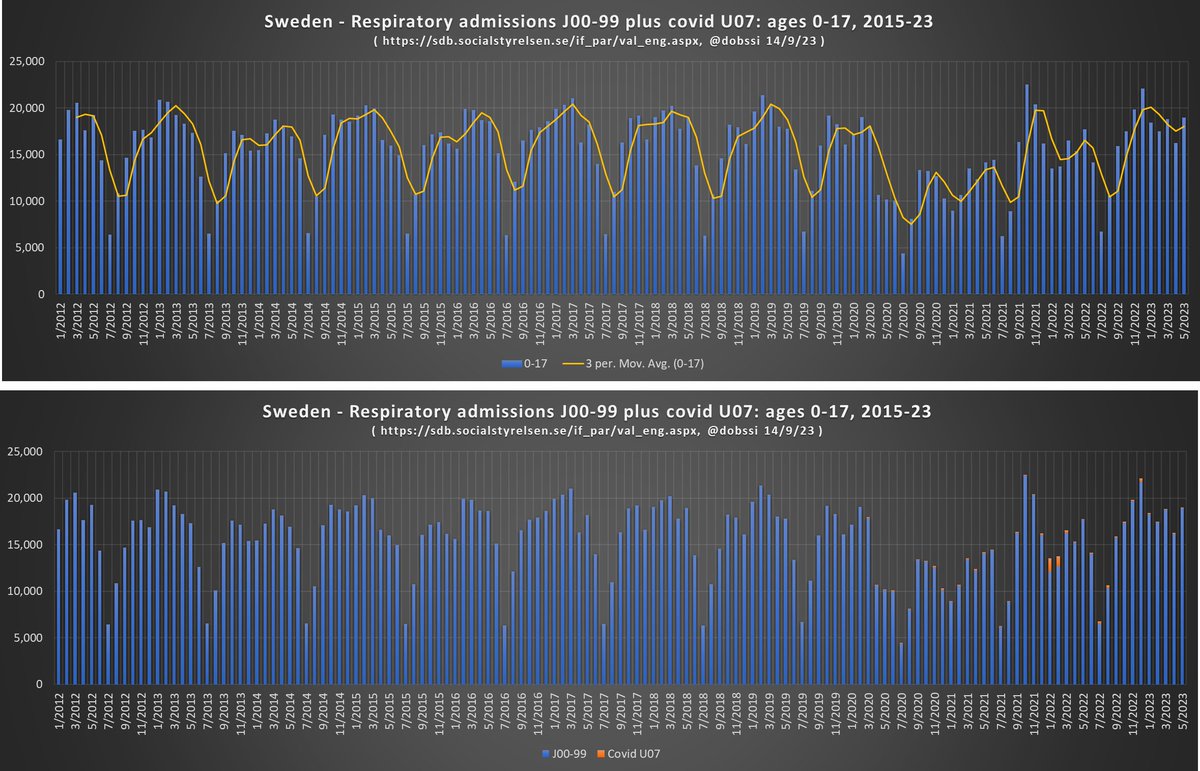
So to start off, here is the outline of the pandemic in Sweden showing "covid as main cause" deaths and "covid as primary diagnosis" ICU admissions.

As we can see, slightly different death and ICU wave profiles.....

Note the lack of "death waves" for Alpha or Delta....

2/ Image
Aug 2, 2023 17 tweets 7 min read
Eastern Europe excess during the pandemic was significantly higher than Western Europe, especially 2021.

How relevant is their lower vaccination uptake?

Or is it down to lower pre-pandemic life expectancy?

Focusing on ages 65+ in this thread to keep things focused....

1/
Image
Image
In my opinion, the key tests of vaccination effect are from 2021 to mid 2022.

After the first Omicron waves by mid 2022 you could assume almost everybody had been infected, and so any vaccine effect would be diluted by natural immunity.

So I focus on Q1 2021 to Q2 2022.

2/
Image
Image
Jul 14, 2023 15 tweets 6 min read
#Sweden’s pandemic…..looking the myths around it.

What is, isn’t and might be true about what happened between 2020-22…..

Thread/🧵 Myth#1

Sweden did nothing, or let it rip.

False. Mostly driven by recommendations but people did reduce contacts mostly in reaction to the situation on the ground. Flatten the curve was the daily message from the authorities in 2020….

1/

https://t.co/xgEubAP6lt
Image
Jul 7, 2023 21 tweets 11 min read
Western European excess mortality estimates, latest @EU_Eurostat, @ONS and @HMDatabase data:

- 15 countries included for all ages and 65+
- 14 countries included for 20-44 and 45-64

Sadly age-stratified Ireland data still not available on Eurostat so still excluded.

1/


Start with all ages per year. 2023 so far is better, but still not below baseline, as we would hope to see over time as we leave the pandemic behind.

2/


Jul 2, 2023 12 tweets 6 min read
Initially persuasive claims of placebo vaccine doses but on closer inspection they have overlooked a major confounder - the timeline.

The problem is that they do not seem to have checked the order of the batches.

And we all know the weakest got the first ones......

1/ The data is from a study by Copenhagen University, which looks at adverse effect reports ( not diagnoses ) per batch rolled out in Denmark.

It does indeed find some batches were far more likely to trigger AE reports than others.


2/ https://t.co/YI8JxK1Q3Ponlinelibrary.wiley.com/doi/10.1111/ec…
Jun 8, 2023 9 tweets 5 min read
Scandinavian pandemic Life Expectancy changes:

We now have data for 2020-22 for Denmark, Finland, Norway and Sweden. Surely the best way to compare pandemic deaths is to use this gold standard metric?

And using the best fit baseline as I see it, Sweden perform best so far.

1/ ImageImage Starting with whole population:

2/ ImageImageImageImage
Mar 27, 2023 18 tweets 13 min read
Today @dagensnyheter published what I consider to be the best Nordic/European pandemic excess mortality mainstream media piece so far.

It is excellent data journalism and gets so much right...but there are some frustrating flaws and omissions.

1/

dn.se/sverige/fakta-… 
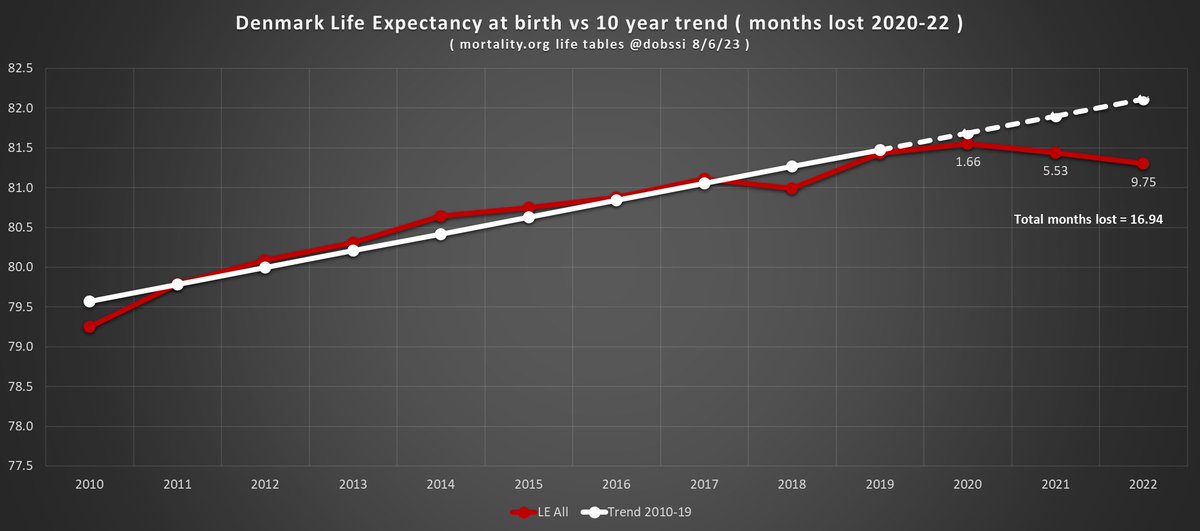
First of all what it gets right.

It uses Age Standardised @EU_Eurostat data - a huge step forward. And also the pre-pandemic trend from 2012-19 as a baseline - which is as good a choice as any and certainly better than 2015-19 which is prone to distortion by outlier years.

2/ Excellent visualisation of actual vs expected death rates.
Mar 24, 2023 15 tweets 10 min read
Various accounts are claiming birth rates are falling due to the vaccines.

So I downloaded @EU_Eurostat monthly birth data to check it out.

TLDR. They are falling in some places, but any slight correlation with vax rates is in the opposite direction - more vax, more births.

1/ Eurostat have complete births data to June 2022 for most EU/EEA countries in this dataset so I have taken the 7 year trend up to 2019 for the first half of each year, and from that calculated the excess or deficit in births for 2020-22, period Jan-Jun.

2/
ec.europa.eu/eurostat/datab…
Mar 22, 2023 6 tweets 3 min read
@SCB_nyheter have produced a new article on Nordic excess mortality.

Its a curious one, also explained by @Jean__Fisch below.

I'm not sure it clarifies anything beyond what we already know - Sweden, Norway and Denmark all did quite well.

1/

scb.se/hitta-statisti… ImageImage But instead of using one of the methods I set out here, where you can get similar results using a trend baseline and ASMR or not, they have given two options - the average of X years and then a calculation based on population projections made in 2019.


2/
Mar 18, 2023 11 tweets 8 min read
Excess mortality estimates - Age Standardised rates vs Raw numbers.

Comparing the two metrics here. Using a pre-pandemic trend baseline we get broadly similar estimates for 2020-22.

@Martin__Sauter

1/ 
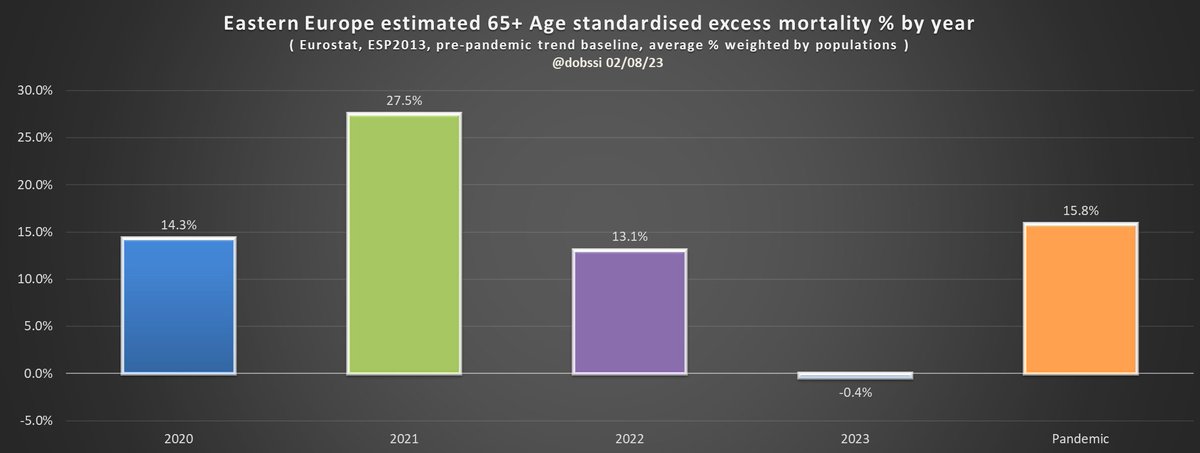
There are minor anomalies, eg the Nordics seem overestimated by Raw numbers as do South Korea and Germany - all countries with high life expectancies and ageing populations.

But overall the pre-pandemic trend baseline works quite well with raw numbers...

2/
Mar 16, 2023 9 tweets 9 min read
Ok, since nobody can 100% agree on excess mortality methodology and results why not use Life Expectancy ( LE )? Nobody doubts that metric do they?

Using Age Standardised Mortality Rates for 2022 to estimate 2022 LE figures I get this for months lost 2020-22:

Look familiar?

1/ These are my predictions for 2022 based on the ASMR values for the year, based on the relationship between ASMR and LE in previous years.

Main themes - Eastern Europe regaining some lost ground. Finland, Norway and Germany seeing notable falls ( 0.8 years, 0.5 and 0.5 ).

2/
Mar 6, 2023 22 tweets 12 min read
A lot of debate right now about this @SvD chart showing #Sweden with the lowest excess mortality in Europe for 2020-22.

Obviously this is causing something of a stir.

So is it a plausible claim?

TLDR - yes, maybe....but it's not quite so simple....

1/

europaportalen.se/2023/03/sverig… The first thing to note about the data that @SvD used is that it's not adjusted for age or population changes. It is simply the number of deaths in 2020-22 measured against the number of deaths in 2017-19.

An elegant and simple method at first sight, but there are problems.

2/
Mar 4, 2023 8 tweets 4 min read
New Eurostat data out so quick excess estimate update....

Western Europe 2020-22:

1/ Image 
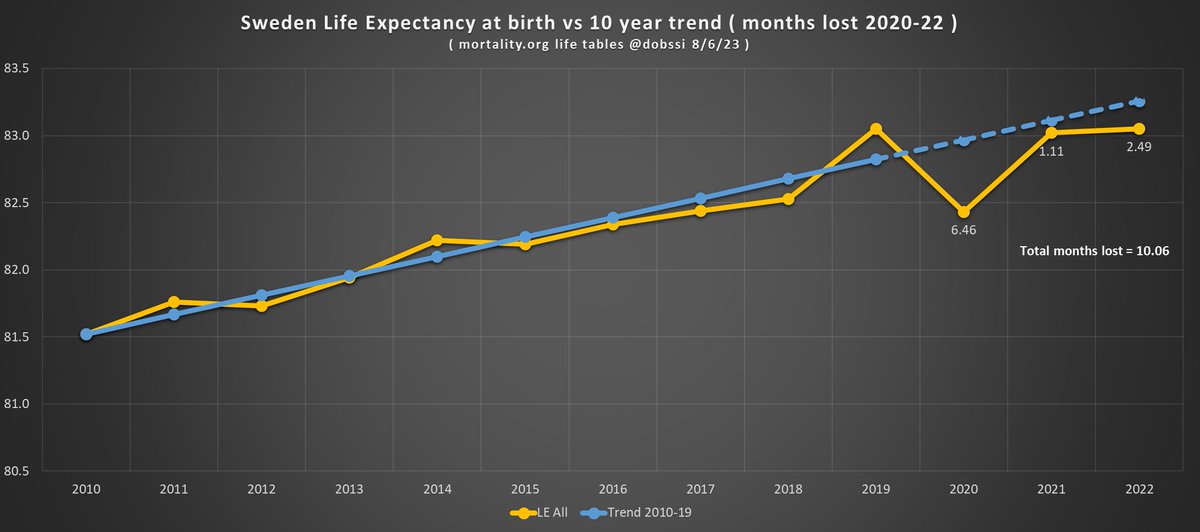
Scandinavia 2020-22 per 100k:

2/ ImageImage
Feb 27, 2023 8 tweets 4 min read
So much more debate and bickering about masks since this Cochrane study emerged.

I think the whole debate can largely be distilled into one chart. Sweden had an average 3% mask use for 2020-22. Western Europe about 40%.

Spot the effect on mortality. Spoiler - you cannot. 
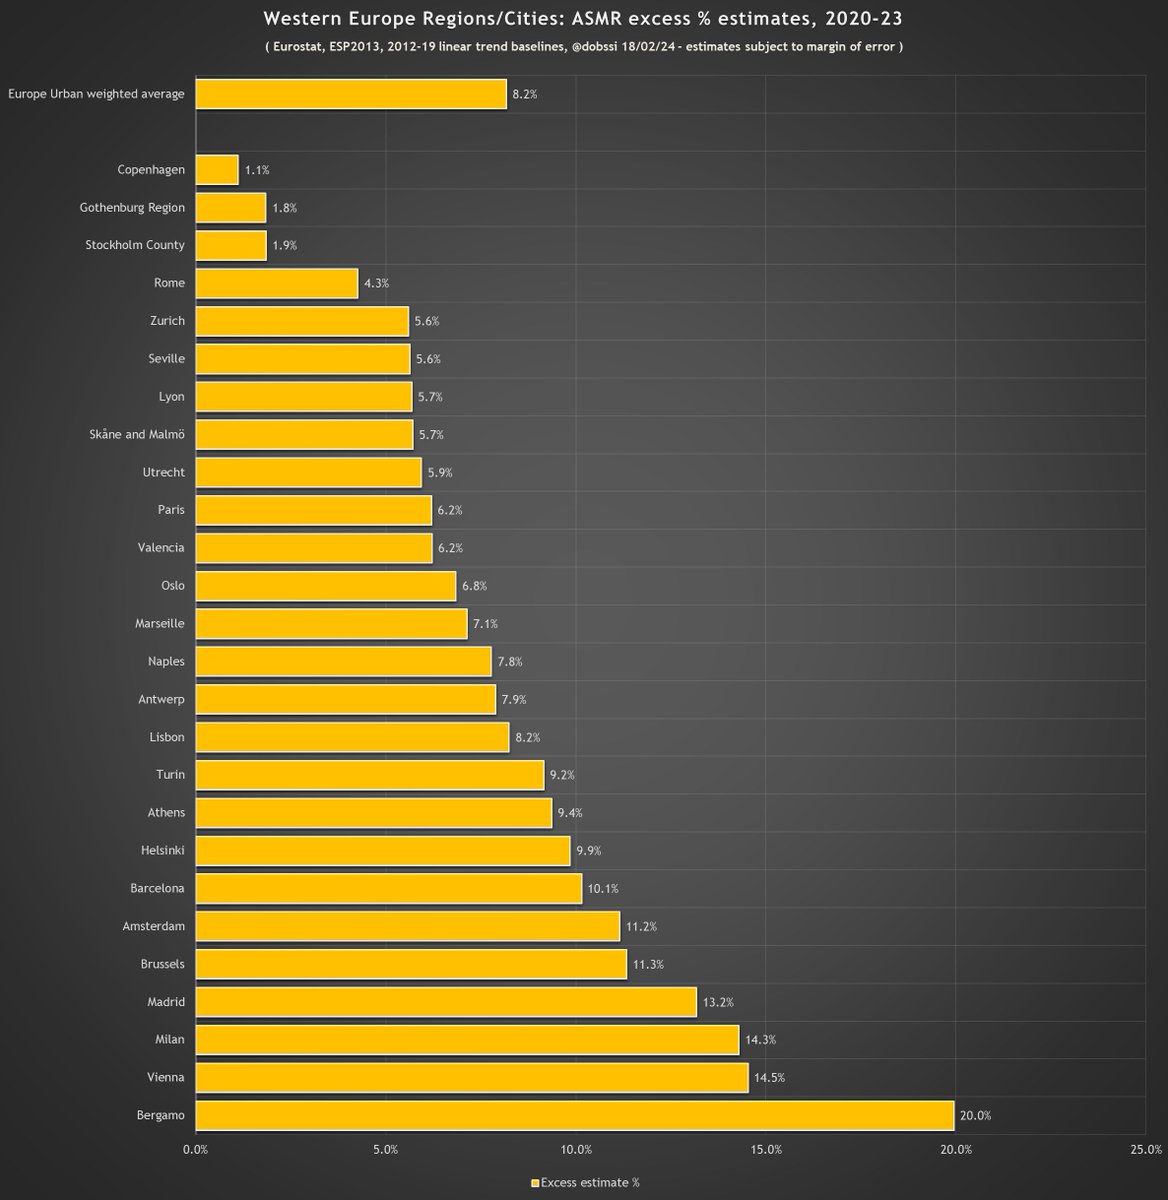
Western European group consists of:

Austria, Belgium, Denmark, England/Wales, Finland, France, Germany, Italy, Netherlands, Norway, Portugal, Spain, Sweden and Switzerland.

Sweden is pretty much on the average of this group vax wise. Maybe a little higher 65+, less in younger.
Jan 6, 2023 9 tweets 5 min read
Third part of "Life Expectancy projection trilogy"....

I now reproduce this for 31 countries using
@HMDatabase
data to predict Life Expectancy for 2022, and compare to the pre-pandemic trend.

Pandemic Life Expectancy as a proxy for excess mortality......

1/ Here we start with LE for 2012-21 from the UN data set.

I will calculate months lost for 2020-21 compared to what we think LE would have looked like had there been no pandemic - using 8 year linear trend for 2012-19.

🇰🇷🇳🇿shown here as examples.

2/

population.un.org/wpp/Download/S…
Jan 5, 2023 8 tweets 5 min read
Follow up thread:

Life expectancy changes as an alternative to excess mortality using Eurostat and UN data: metric - estimated LE months lost 2020-22 vs pre-pandemic projections...

1/ We start with Life Expectancy for 2013-21 from the UN data set.

I will calculate months lost for 2020-21 compared to what we think LE would have looked like had there been no pandemic - using linear trend for 2013-19.

🇸🇪🇩🇪shown here as examples.

2/

population.un.org/wpp/Download/S…