Mayur मयूर Thaker ठाकर Profile picture
Chartered Financial Analyst. Cycling. Eastern spirituality. Drumming. Veganism. ROIC investing. Indian classical music.
Per Wikman-Svahn Profile picture Aloushka 🐍 Profile picture Memmet Salts Profile picture 3 subscribed
Dec 24, 2021 12 tweets 3 min read
Here's my newly rebalanced portfolio, for anyone who cares. Some new adds. 18 companies total.

These are companies who I think will have > 20% IRR for the next 5 years based on my 7-step investment selection criteria. My overall investment analysis framework can be summarized in these 7 steps.

My ultimate goal is to identify the best capital allocators, often led by owner-operators with real skin in the game, that create value by solving problems in the world - and align with them.
Dec 16, 2021 5 tweets 1 min read
As per my personal investment allocation principles, I'll start getting interested in adding more $TSLA when it approaches its average max drawdown level (30-35% pullback from ATH), which means I'd begin adding at around $800/sh.

I've done this every single time since 2016. Image This strategy of buying the avg max drawdown in my favored stocks has allowed me to avoid much larger losses on bad bets (i.e. $Z, $BYND, $NVTA) + increase returns on good bets (i.e. $TSLA, $SQ, $ABBV, $SHAK).
Sep 24, 2021 7 tweets 2 min read
Operating cash flow, and its sister Adjusted EBITDA, will remain the most relevant metrics to base $TSLA multiples on as CAPEX picks up over the next 10 years to reach >10M unit vols, imo.

I see cash flow margins continuing to rise even as ASPs fall from the current $47,000. Image 
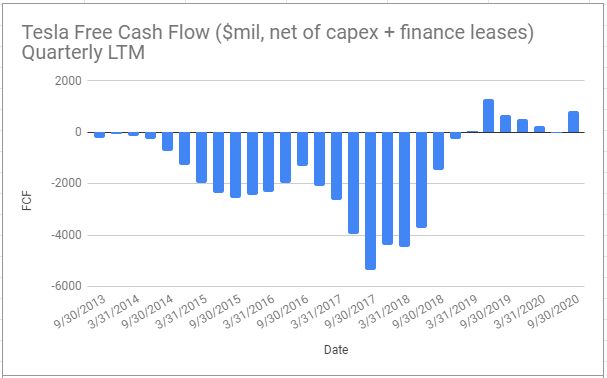
Why cash flow margins will continue to rise despite ASPs falling:

📈Operating leverage
📈Fixed cost absorption
📈Incr. capacity utilization
📈Incr. mix of higher margin products (Plaid, FSD)
📈Iterative factory optimization
📈Incr. labor productivity
📈Localized supply chains
Sep 20, 2021 8 tweets 3 min read
$TSLA auto gross margins *rose* significantly in Q2 '21 while ASP has basically stagnated at all-time lows around $47k. This is prior to regulatory credits revenue.

This is only possible with serious operating leverage + higher mfr efficiency, which reduces COGS/unit. If Tesla is kicking off 23% cash ROIC on 700k unit deliveries (TTM) across two factories, despite operating at only 70% capacity, and if Berlin and Austin factories are anywhere near as cost efficient as Shanghai, I think it's likely for Tesla's cash ROIC to reach 40% in < 4yrs.
Sep 9, 2021 6 tweets 2 min read
Rather than making investment decisions based on what you think the appropriate valuation multiple ought to be, I let Mr. Market guide me what the right multiple is.

2-Step Process:

1. Trades at a discount to intrinsic value.
2. Buy the max drawdown

Read on... 1. The simplest approach to estimate intrinsic value 5-years from now vs today's market cap, with a minimum required return of 15% per annum.

Calc:

[( 5-yr Fwd Revenue Est X 10-yr Avg P/Sales Multiple) / (Current MCap)] ^ (1/5) - 1 > 15%
Jul 20, 2021 6 tweets 2 min read
Here's the real reason why $TSLA is valued like tech and not like other autos, and it's not just the faster growth.

The separation in the rate of return on investments is unreal.

I've said this before: ROIC (in its various forms) is the most important concept in all of finance. Here's the full table with data and footnotes.

Cash ROIC = operating cash flow / average invested capital. IC = net working cap + fixed assets.

All data pertains to the auto division only to ensure apples-to-apples comps.
Jan 31, 2021 8 tweets 3 min read
Here are 6 interesting facts about $GME and why it was a perfect setup for an epic short squeeze:

1. At multiple points in 2020, market cap traded < cash & equiv on balance sheet. In fact, avg market cap in 2020 = $461m, while 4-qtr avg cash & equiv on balance sheet = $600m As a corollary, $GME traded at a substantial discount to its own book value, hitting lows of 0.3x and remained under 0.7x thru much of 2020. This is also a substantial discount to the retail industry average P/Book.

Stocks that trade this cheap are usually priced for bankruptcy
Dec 29, 2020 18 tweets 4 min read
A lot has been said about $TSLA's future returns given its monster 20X move from the 2019 "restructuring story" Adam Jones bottom.

A valid point is brought up by the bears: Tesla could execute to perfection and the stock could **still** drop sizably.

Long but easy thread. Comparisons have been drawn of the current environment to the late 1990s bubble period, in which both legitimate and illegitimate stocks experienced euphoric valuations. Microsoft, Cisco, Amazon, and Apple all appreciated significantly along with worthless dot-com busts.
Oct 26, 2020 8 tweets 2 min read
Important tidbits from $TSLA Q3'20 10-Q for long-term investors:

1. Top Agenda: decrease production costs to increase affordability. In-house 4680 cell production + iterative mfr design play a big role in this.

2. Expected incr. non-GAAP net margins due to op. leverage tailwind 3. Total CAPEX in '21-22 = $4.5-6b; continued self-funding with op. cash flow > CAPEX spend.

NOTE: while this is a high spend, not all of it hits cash right away as ~1/3 of it comes in the form of capital leases, which are noncash except periodic principal & interest pmts.
Jun 6, 2020 15 tweets 4 min read
Thread: @AndrewYang was right. We need a #UBI and universal healthcare coverage.

The civic unrest we're witnessing is a symptom of serious underlying economic problems. Race relations are merely a trigger, but in my view, it's an ever widening wealth gap.

I have 2 proposals: 1. Implement a #UBI of $1000/mo for all US citizens & PR holders >= age 18, and index it to total federal tax revenue, which has grown 4.92%/yr since 1980.

As tax rev grows, so does the UBI, with a high watermark, so if tax revenue falls (recessions, etc), UBI remains steady.
Dec 28, 2019 6 tweets 2 min read
TESLA CHARTS: 2013 - Present.

All numbers arranged in TTM annual bars. For example, 2019 refers to 4Q18-3Q19, 2018 = 4Q17-3Q18, etc.

Revenue:
45.2% annualized (least squares) with a 99.2% r-squared on the exponential regression curve. Gross Profit:
36.8% annualized (least squares) with a 99.2% r-squared on the exponential regression curve.