
No longer active here.
Obsessed with data graphics. I design high‑stakes charts.
Founder, Visionary Press • CHARTOGRAPHY weekly
 loving this AI-generated Chart-Chat truck-chart

 2/ winter line graphs

 1991's Micrografx Charisma 2.1 designed for Microsoft Windows 3.1
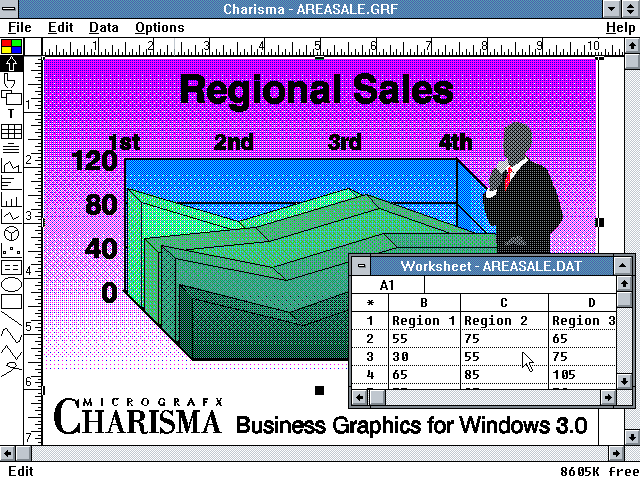

 2/n: more recent favorite books I pull off the shelves a lot
 2/ Garcia Cubas 1885 Atlas Pintoresco E Historico davidrumsey.com/luna/servlet/s…
 @Emojipedia Before specific ratings, let's look at some general trends.
 for Advent I am making palettes inspired by a set of French thematic maps
 INFO WE TRUST's climax concerns the orientation of French Gothic cathedrals. This story is intro'd with Notre Dame de Paris:
