
Labour market innovation & adult skills @nesta_uk | Anthropology advocate tweeting about #opendata #futureofwork #AI | Views my own etc.
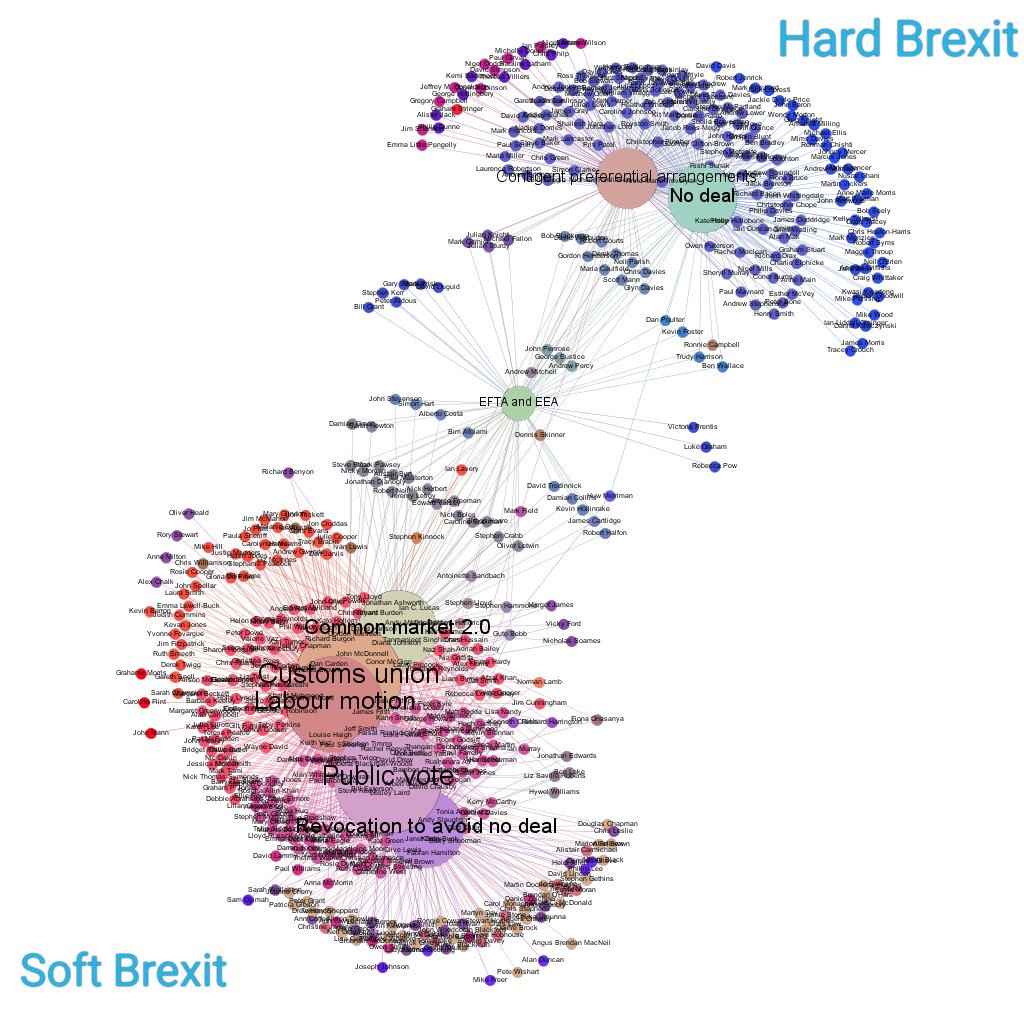 Among the Conservatives, there are two main clusters: a majority who want a harder Brexit (top right), and those keen on something softer (bottom left). This is the most divided party - and the previous chart shows it has a voting pattern distinct from the rest of Parliament.