I code in R and love all things ✨data✨ #DataViz #ADHD #RStats https://t.co/o2Z0lHzpzL
Apr 23, 2022 • 17 tweets • 5 min read
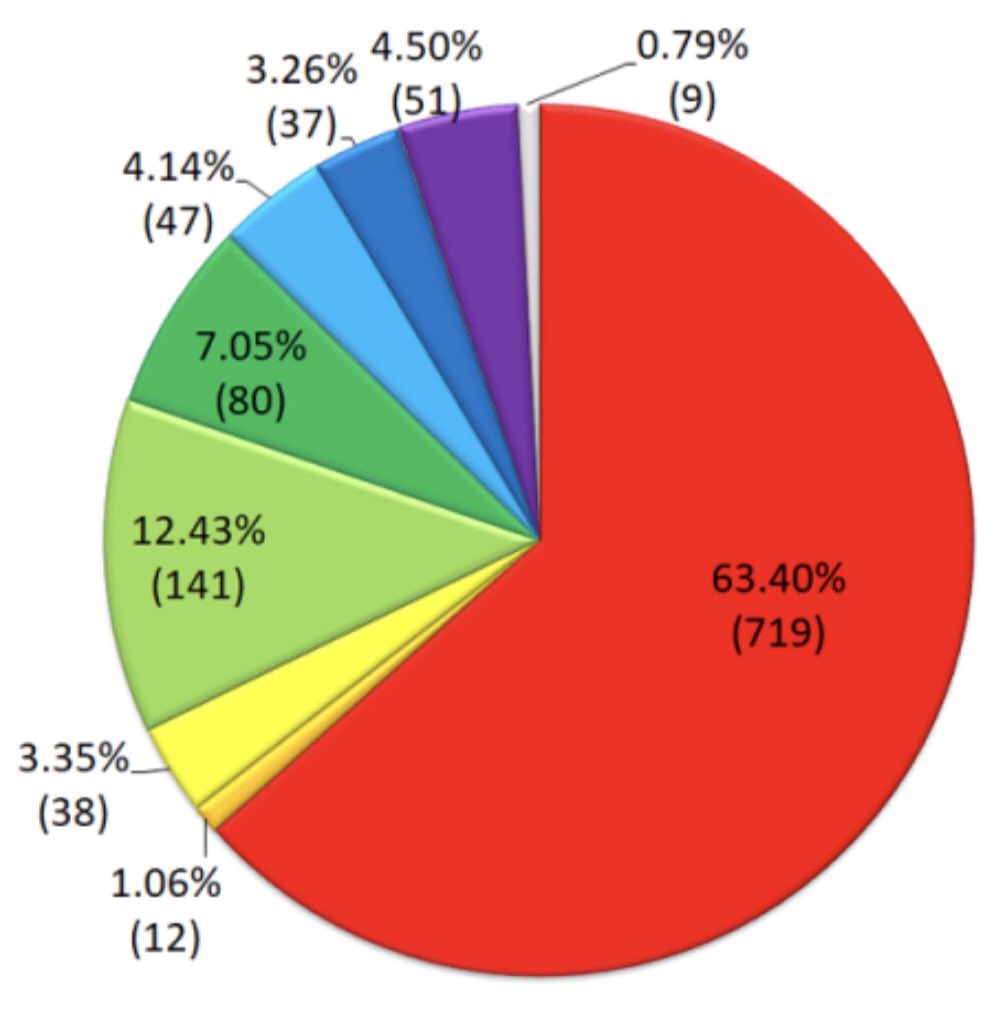
Found a really interesting survey, went to look at the results and the charts were physically painful to look at. So many #dataviz violations 😩 Here are some things I noted that should’ve been avoided:
A thread 🧵 (1/16)
1. PIE CHARTS - Unlike most data viz experts, I don’t completely *hate* pie charts. However, I think they should be used very sparingly and only when 2-3 categories are being represented.
(2/16)
Jun 29, 2021 • 15 tweets • 5 min read
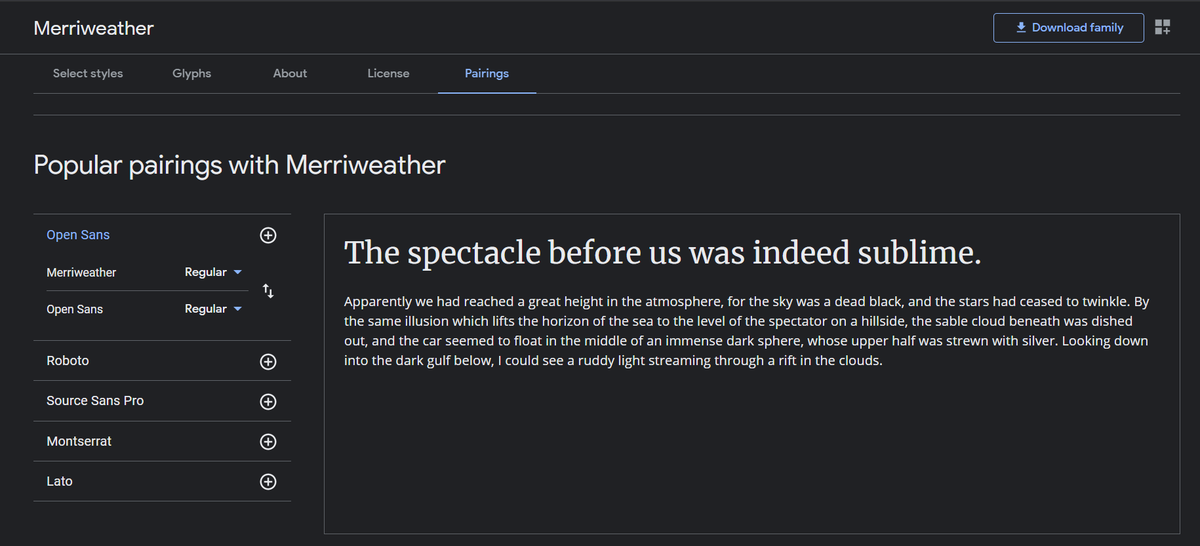
Sick and tired of the default R fonts? Here’s a comprehensive guide to using different fonts in ggplot2!
🧵 THREAD [1/15]
STEP 1: Find a font. There are many places to find fonts such as fontspace.com and fonts.google.com (which is what I use). Regardless of where you get your font, make sure you download it as a TrueType Font (.ttf) file!
[2/15]
May 20, 2021 • 22 tweets • 10 min read
Having trouble picking a color palette for your #Rstats visualization? Well here's a MEGA thread about all the ways you can choose a palette! 🧵[1/22]
We'll start off with the classics. First, you can use the palettes that are already a part of R's base code (keep in mind that these palettes were not necessarily designed to be colorblind-friendly)