Pew Research Center Profile picture
Nonpartisan, non-advocacy data and analysis. Follow us on Instagram, Facebook and LinkedIn or subscribe to our newsletters: https://t.co/tawtYBr8Ef ✉️
Sep 15, 2022 6 tweets 2 min read
Sep 13, 2022 10 tweets 5 min read
NEW: The accelerating trend of Americans leaving Christianity to join the growing ranks of U.S. adults who describe their religious identity as atheist, agnostic or “nothing in particular” is reshaping the U.S. religious landscape. (THREAD: 1/) pewresearch.org/religion/2022/… Depending on whether religious switching continues at recent rates, speeds up or stops entirely, current projections show Christians of all ages shrinking from 64% in 2020 to between 54% and 35% of all Americans by 2070. 2/ pewresearch.org/religion/2022/… Chart of projected U.S. Chr...
Nov 18, 2021 14 tweets 7 min read
NEW: We asked adults across 17 advanced economies what they value in life. From family to material well-being and health, here’s what they said: (THREAD 1/) pewresearch.org/global/2021/11… From analyzing people’s answers, one source of meaning is predominant: family. In 14 of 17 advanced economies surveyed, more mention their family as a source of meaning in their lives than any other factor. 2/ pewresearch.org/global/2021/11… Image
Nov 9, 2021 14 tweets 5 min read
Introducing the 2021 political typology groups. Let’s start with the groups that lean toward the Republican Party, from the most conservative to the least conservative... (thread) pewresearch.org/politics/2021/… Faith and Flag Conservatives are staunchly conservative on all issues; deeply loyal to Trump. Highly religious and politically engaged, they favor a robust role for religion in public life and a smaller role for government. The oldest typology group, they have a median age of 57. Image
Nov 9, 2021 11 tweets 4 min read
NEW: We’ve just released the 2021 U.S. political typology. Inaugurated over 30 years ago and last updated in 2017, the typology sorts Americans into cohesive groups based on their values, attitudes and views of the political system and the parties. pewresearch.org/politics/2021/… This year’s typology survey is among the largest we have conducted. A road map to today’s fractured political landscape, it segments the public into nine distinct groups: four GOP-leaning, four Democratic-leaning and one that is split between the parties. Image
Sep 21, 2021 10 tweets 5 min read
NEW: India’s fertility rate has been declining rapidly in recent decades. As of 2015, the average Indian woman is expected to have roughly 2.2 children in her lifetime, a fertility rate much lower than India’s average in the past. (THREAD: 1/) pewforum.org/2021/09/21/rel… Every major religious group in the country has seen its fertility fall, including the majority Hindu population and Muslim, Christian, Sikh, Buddhist and Jain minority groups. 2/ pewforum.org/2021/09/21/rel…
Jul 8, 2021 9 tweets 4 min read
Religious belief is key to many Americans’ political identities, but the public is divided on whether clergy should preach about politics from the pulpit. So how did pastors address their congregations during the 2020 election? (THREAD 1/): pewrsr.ch/3hHDnhy Our new analysis finds that among churches that posted their sermons, homilies or worship services online between August 31 and November 8, 2020, two-thirds posted at least one message from the pulpit mentioning the election. 2/ pewforum.org/2021/07/08/pas…
Feb 22, 2021 13 tweets 7 min read
NEW: We look back on the findings and key takeaways from our American News Pathways project (conducted from November 2019 through December 2020) in our new analysis. (THREAD 1/)journalism.org/2021/02/22/how… 24% of Republicans consistently turned only to news sources with right-leaning audiences in at least 2 of 3 Pathways surveys, and 25% of Democrats chose only sources with left-leaning audiences. 2/ journalism.org/2021/02/22/abo…
Feb 1, 2021 7 tweets 4 min read
We’ll be sharing findings about Black Americans for #BlackHistoryMonth in this thread. First up: a recent post examining the slow but steady progress Black Americans have made in gaining a greater foothold in U.S. political leadership. pewrsr.ch/3pEdKkP About three-quarters of Black adults say that being Black is important to how they think about themselves, and 81% feel connected to a broader Black community in the U.S.
pewrsr.ch/3aDnntN #BlackHistoryMonth
Aug 11, 2020 11 tweets 6 min read
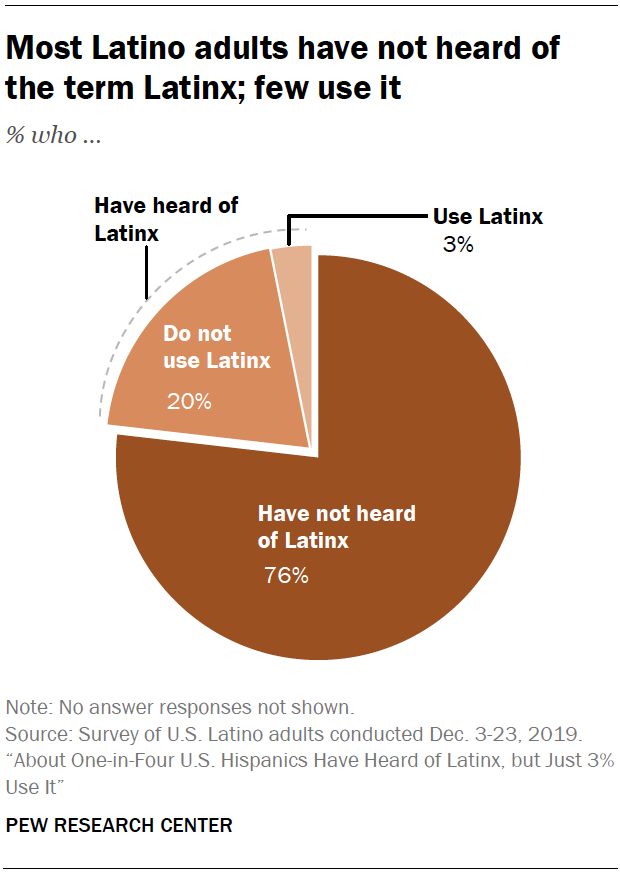
NEW: 23% of U.S. Hispanics have heard of the gender-neutral pan-ethnic label, Latinx, but just 3% say they use it to describe themselves. 1/ pewrsr.ch/2F9F7AB Awareness of the term Latinx varies across Hispanics – young Hispanics, those with college experience, those born in the U.S. and those who predominantly speak English are the most likely to have heard of it. 2/ pewrsr.ch/2F9F7AB
Aug 4, 2020 12 tweets 5 min read
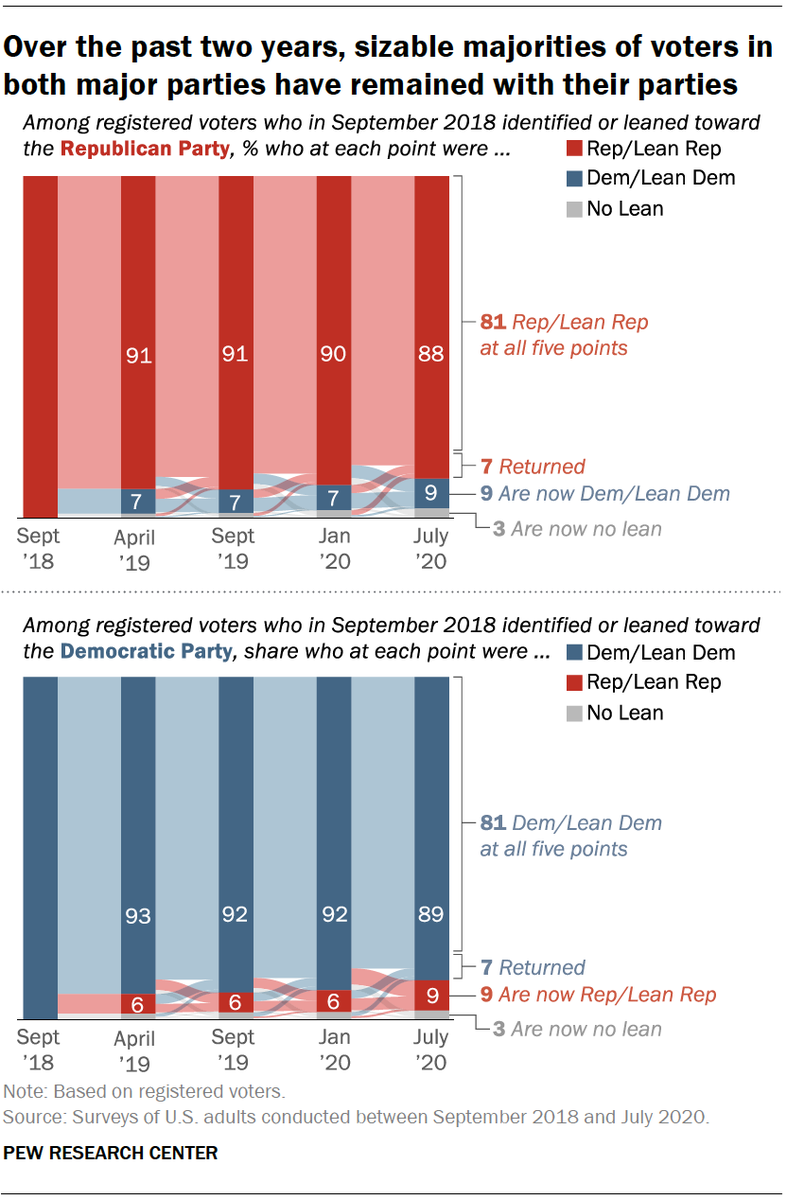
NEW: Overwhelming majorities of both Republican and Democratic voters have retained their party affiliation over the past two years, a tumultuous period marked by a global pandemic, mass protests against racial injustice and a presidential impeachment. 1/ pewrsr.ch/2DjjRrH About one-in-ten voters (9%) who identified as or leaned Republican in September 2018 now identify as Democrats or lean Democratic. An identical share of voters (9%) who two years ago identified as Democrats or leaned Democratic now align with the GOP. 2/ pewrsr.ch/2DjjRrH
Mar 8, 2019 25 tweets 19 min read
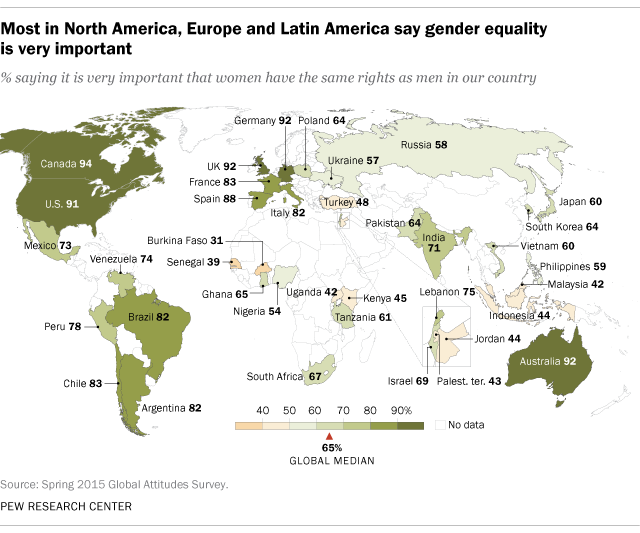
We have a wealth of findings about women. Here is a selection for #InternationalWomensDay Many around the world say women’s equality is very important, according to our 2015 global survey. This sentiment was strongest in North America, Europe and Latin America. pewrsr.ch/2J0UdtI #InternationalWomensDay
Aug 9, 2018 11 tweets 3 min read
In an effort to better understand the 2016 electorate, we matched members of our nationally representative American Trends Panel to a national voter file to create a dataset of verified voters. (Thread on findings follows.) pewrsr.ch/2KFmuSe Among these verified voters, the overall vote preference mirrors the election results very closely: 48% reported voting for Hillary Clinton and 45% for Donald Trump. (Actual election result was 48% Clinton - 46% Trump)
Aug 9, 2018 16 tweets 5 min read
We’ve just released a new study examining views of President Trump among those who voted for him in the 2016 election. (Thread on findings follows.) pewrsr.ch/2KEAdc6 This analysis is from our American Trends Panel, which allows us to survey the same group of U.S. adults at multiple time points to determine how their views changed over time. (Not possible with a traditional cross-sectional survey.)
Dec 26, 2017 19 tweets 6 min read
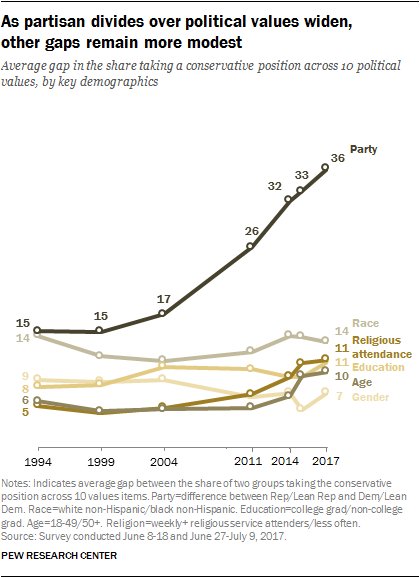
We study a wide array of topics both in the U.S. and around the world, and every year we are struck by particular findings. Here are 17 findings that stood out to us in 2017. pewrsr.ch/2zyRygQ 1. Partisanship has eclipsed all other demographic differences when it comes to political values.