Nicholas G. Reich Profile picture
UMass professor, statistician, public health and infectious disease researcher, data scientist, juggler, puzzler, English major. Tweets are my own.
Dec 16, 2021 10 tweets 5 min read
It's logical to think that rises in #COVID19 cases in the US would precede rises in hospitalizations. After all, one has to get infected and typically become symptomatic before being hospitalized. But the data tell a slightly different story. 1/n Take Texas.

Look at daily counts of #COVID19 cases, hospitalizations, and deaths over the pandemic (scaled: peaks at 1).

Then, look at the relative change (today's # divided by the # 7 days ago), smoothed over time.

Cases and hospitalizations are closely aligned. Deaths lag. Image
May 26, 2020 12 tweets 9 min read
Another Tuesday brings another weekly update from the #COVID19 Forecast Hub. Our ensemble model averages 10 different models and predicts that we will see ~123K deaths in the US by June 20, 2020.

reichlab.io/covid19-foreca…

1/11 
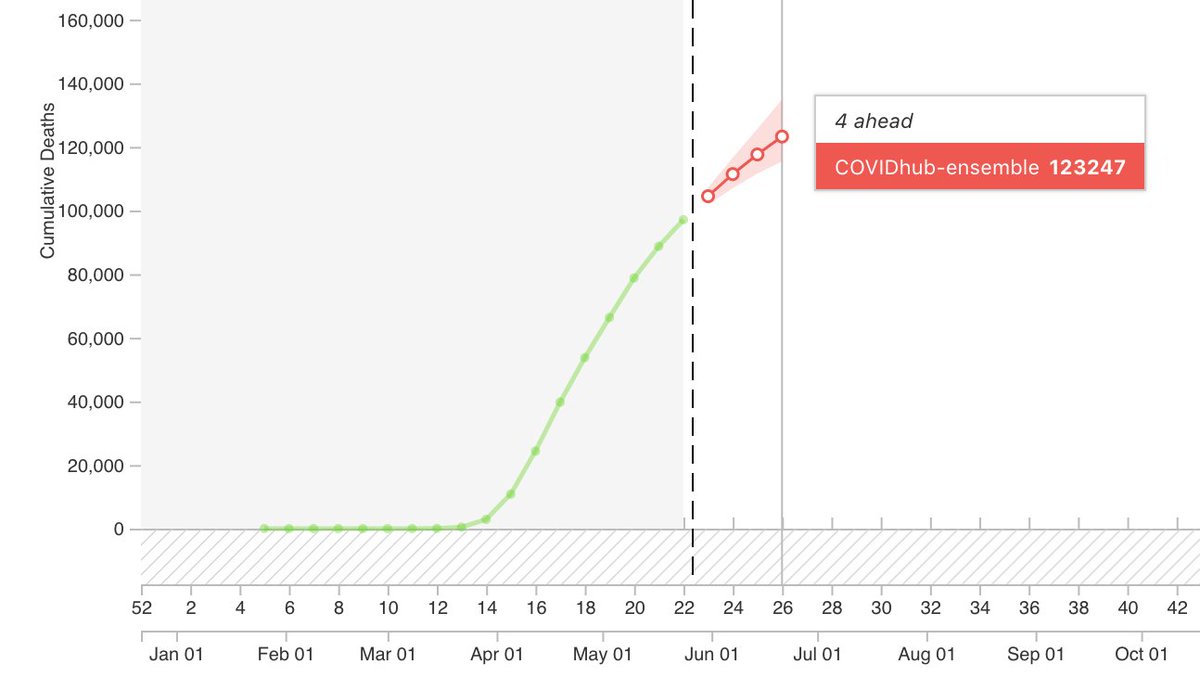
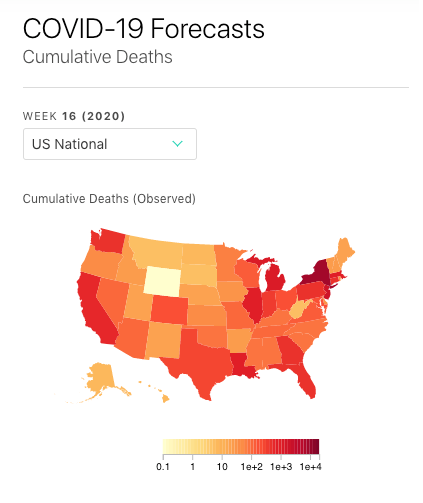
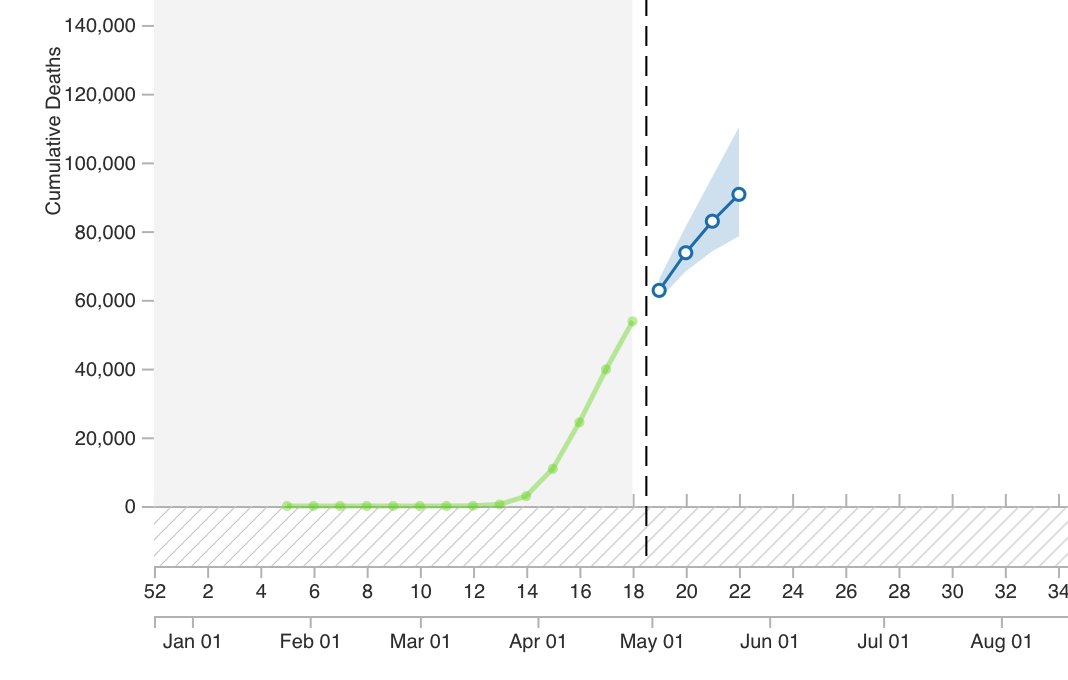
The ensemble says that by June 20 there is a 10% chance of seeing fewer than ~117K cumulative #COVID19 deaths in the US and a 10% chance of seeing more than ~130K.
2/
May 12, 2020 10 tweets 9 min read
Here is the weekly update from COVID Forecast Hub, where we are storing forecasts of #COVID19 deaths in the US from 20 research groups. Our national ensemble combines 7 models and predicts that we will see ~113K deaths by June 6 (80% PI: 104K-123K).
reichlab.io/covid19-foreca…

1/10 
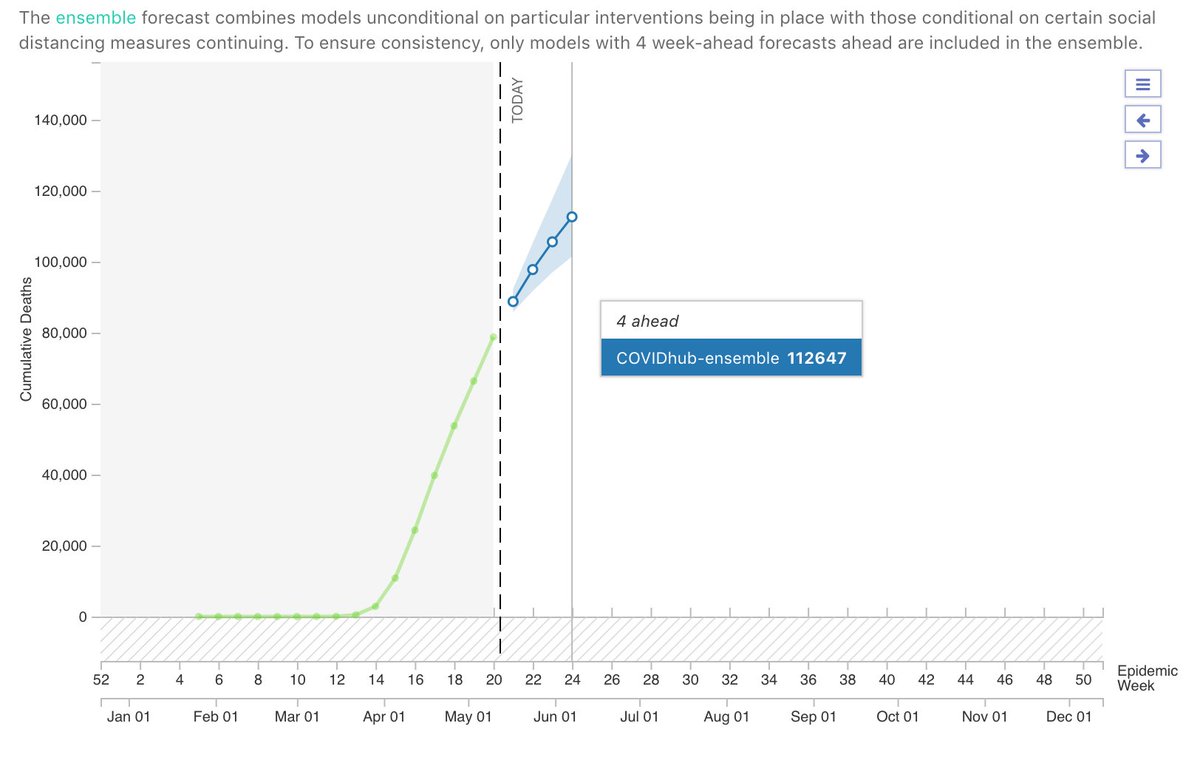
The ensemble model is now 85-90% certain that we will reach 100K #COVID19 reported deaths in the US by May 30.

This represents a slight increase and tightening in certainty compared with what the forecasts said last week.


2/
May 5, 2020 8 tweets 8 min read
Over here at the COVID Forecast Hub, our team has curated forecasts of #COVID19 deaths in the US from 15 research groups. Our new national-level ensemble combines 7 models and predicts that we will see ~103K deaths by May 30 (80% PI: 93K-119K).
reichlab.io/covid19-foreca…
1/8 
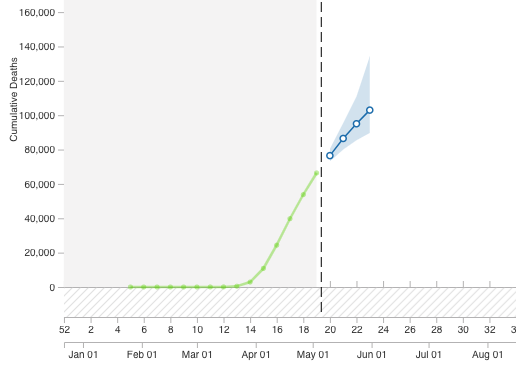
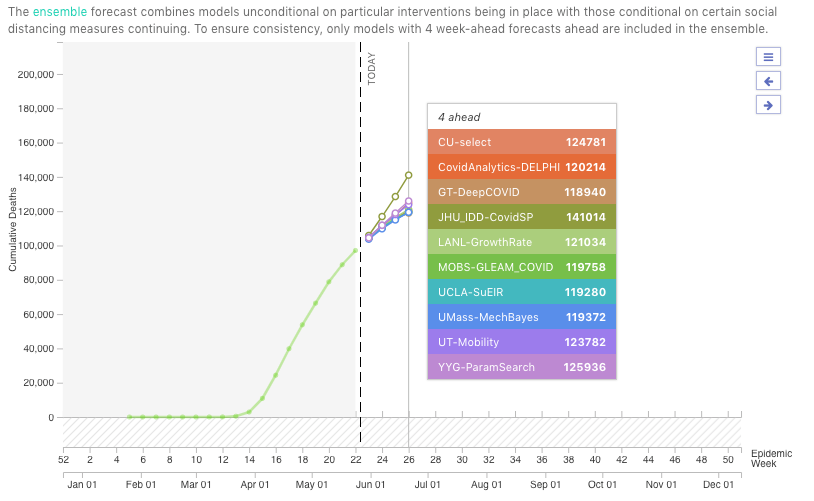
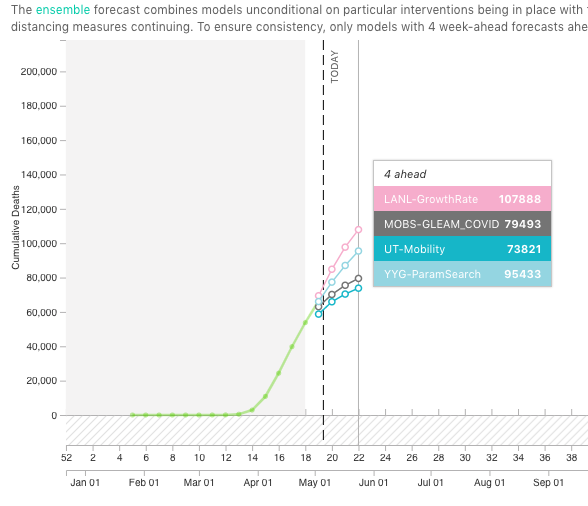
Interestingly, the long-term forecasts for cumulative #COVID19 deaths show a bit more agreement this week than they have in previous weeks. See below for 7 models' US forecasts for last week and 4 from the previous week.)

Explore the raw data yourself:
github.com/reichlab/covid…
2/
Apr 29, 2020 6 tweets 6 min read
We are continuing to curate forecasts of #COVID19 deaths in the US from multiple teams. Our current national-level ensemble combines three models and forecasts ~90K cumulative deaths by May 23 (80% PI: 82K-104K).
reichlab.io/covid19-foreca…
1/6 
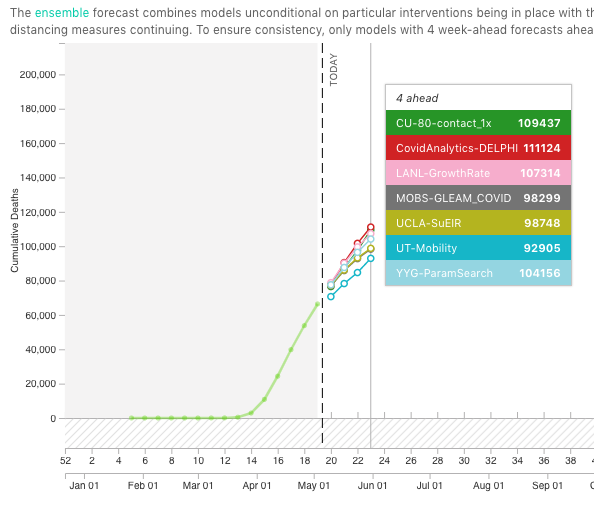
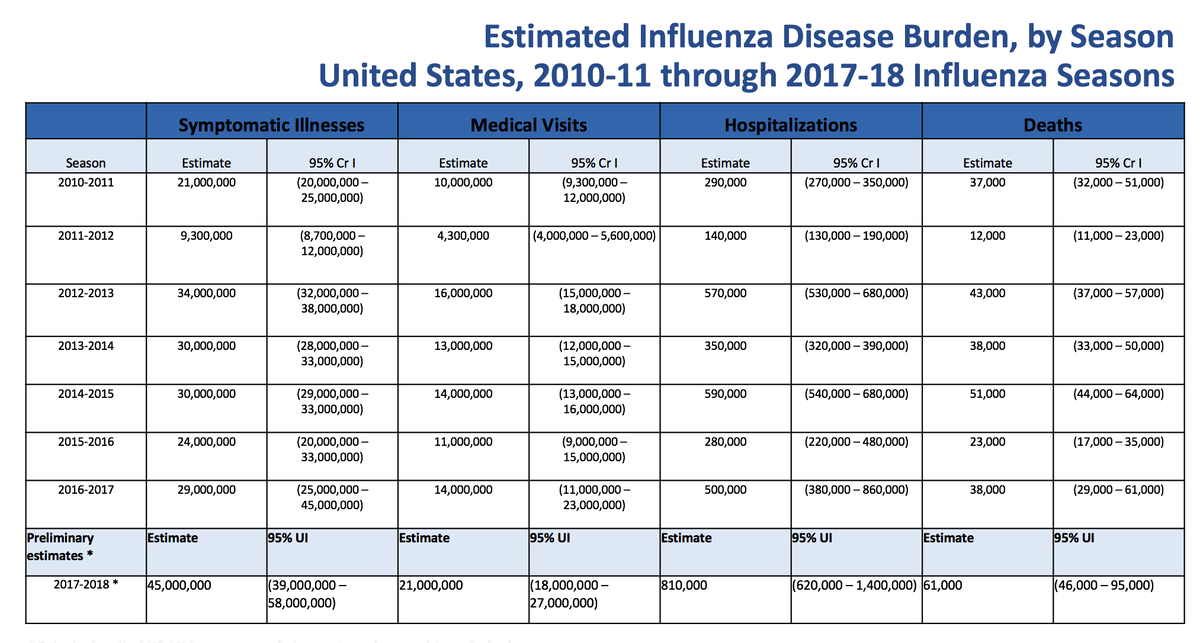
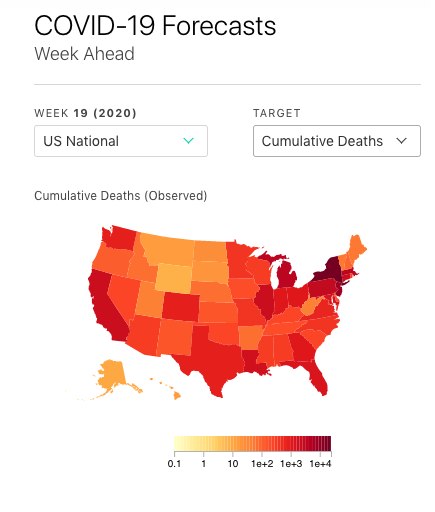
In general, the message of these models seems to be that #COVID19 is going to continue to exact a large toll in the US, with mortality by late May or early June likely to exceed even the upper-bound estimates of deaths caused by any recent flu season.
cdc.gov/flu/about/burd…
2/
Apr 17, 2020 13 tweets 9 min read
In both the near term (the upcoming weeks) and long term (months), models are going to continue to play an important role in setting policy as we persevere in the fight against #COVID19. 1/13
Ensuring that modelers work together to deliver the best data to #COVID19 decision-makers is critical. With this in mind, my group has started to replicate a collaborative framework that has been successful in predicting seasonal flu outbreaks. 2/
reichlab.io/flusightnetwork
Apr 10, 2020 10 tweets 7 min read
I'm appreciative of the hard work and courage of teams who have put out public #COVID19 forecasts. This outbreak has been really hard to predict from the outset. There is so much that we don't know about how all of this will unfold in coming weeks and months. 1/10 I've done some spot-checking of forecast accuracy of a few of the US models, and am planning a more thorough analysis of models that have been put out by @IHME_UW @Columbia @LosAlamosNatLab @alexvespi @MRC_Outbreak and others. 2/ ImageImage
Mar 27, 2020 8 tweets 4 min read
For the last two months, @cmyeaton and I have been leading a weekly analysis of publicly available influenza-like illness (ILI) data and flu test results from the @CDCFlu and state health departments.

1/
The idea here is that if visits for ILI increase at the same time that flu positivity rates are declining, this might be a sign that there is another pathogen, perhaps #COVID19, causing influenza-like illness.

2/
Mar 21, 2020 5 tweets 3 min read
Since mid-Jan, @cmyeaton, myself, et al have been sending out weekly reports about influenza-like illness (ILI) in the US. It started out as a curiosity, with us thinking that maybe #COVID19 was already here in the US and we just weren't seeing it yet.

1/
These reports are not peer-reviewed (we will, when we find time to breathe again, submit a version of this to a journal). For now, we continue to find the report to give us useful intuition about this VERY rapidly changing situation.
2/