Selçuk Korkmaz Profile picture
Trying to simplify statistics
Jin-Ho Yun Profile picture lara behnke Profile picture 2 subscribed
Aug 10, 2023 11 tweets 3 min read
Reporting Regression Results Beautifully Using R 📈✨

💎 Intro:
Making Beautiful Reports in RSo, you've run a regression in R and now you're staring at a wall of numbers? Let's transform that data mountain into a readable, pretty format!

#RStats #DataScience 💎 Why the Fuss About Presentation?
Data speaks, but in whispers. To make it sing, we need to dress it up, make it understandable, and shareable especially for non-stats folks.

First, let's fit a linear regression:

regression_model <- lm(mpg ~ qsec + drat + wt, data = mtcars)
Jul 31, 2023 6 tweets 2 min read
🧐 Intro:
Ever wondered the difference between Bayesian and Frequentist reasoning? Let's dive into a chat between two friends, Frequentist (F) and Bayesian (B), as they discuss their views.

#DataScience #Statistics Image 1/ 🧐 Topic: Probability

F: "I view probabilities as long-run frequencies. Flip a coin often enough, and I'll predict the proportion of heads in a hypothetical infinite series."

B: "For me, probabilities represent belief. Say there's a 70% chance of rain? That's your confidence… twitter.com/i/web/status/1…
Jul 30, 2023 9 tweets 2 min read
📊 Diving into the world of data reduction techniques! Let's compare two popular methods: Factor Analysis (FA) and Principal Component Analysis (PCA). A thread! 🧵

#DataScience Image 📍PCA:

PCA is a technique to reduce the dimensionality of data. It identifies orthogonal (perpendicular) axes (principal components) in the data that maximize variance.

#DataScience
Jul 29, 2023 13 tweets 2 min read
1/ 🧵 Dive deep into the differences between Logit and Probit Models! A common question in #DataScience, these two have nuances worth understanding. Let's explore.🔍 Image 2/ Both Logit & Probit models are stalwarts in statistics when modeling binary dependent variables. But what sets them apart? The devil's in the details.📊 #DataScience
Jul 29, 2023 9 tweets 2 min read
1/ 🧵 Let's dive into the age-old debate between #Statistics and #MachineLearning. While they both deal with data, their perspectives, goals, and techniques can differ. Here's a breakdown: Image 2/ Origin & History:
•Statistics: Has its roots in probability theory & has been around for centuries. Traditionally used in areas like economics, biology, and social sciences.
•Machine Learning: Born from computer science & AI. Rose with big data & computing advances.
Jul 28, 2023 8 tweets 2 min read
Is R-square Useful or Dangerous? 📈

1/ R-square, also known as the coefficient of determination, measures the proportion of variance in the dependent variable that can be explained by the independent variables in a regression model.
#DataScience #Statistics Image 2/ Useful? Definitely! R^2 gives us an idea of how well our model explains the variance in the data. Higher values suggest the model explains a lot of the variation; however, it's not the sole criterion for a "good" model.
Jul 28, 2023 8 tweets 2 min read
1/8 📌 Intro
Both correlation and covariance provide insights into the relationship between two variables. While they might seem similar, there are key differences to note. Let's dive in! #DataScience #Statistics Image 2/8 📊 Covariance
Covariance measures the directional relationship between two variables. It can be positive (both variables increase together), negative (one variable decreases as the other increases), or zero (no consistent pattern).
Jul 25, 2023 10 tweets 2 min read
1/ 🤔 Ever wonder how "bootstrapping" works? I recently used it for estimating confidence intervals & someone asked me about its logic. At first, I was stumped, even though I've used it often! Here's my attempt to clarify.

#Statistics #Bootstrapping #DataScience 📈📉 https://towardsdatascience.com/bootstrapping-statistics-what-it-is-and-why-its-used-e2fa29577307 
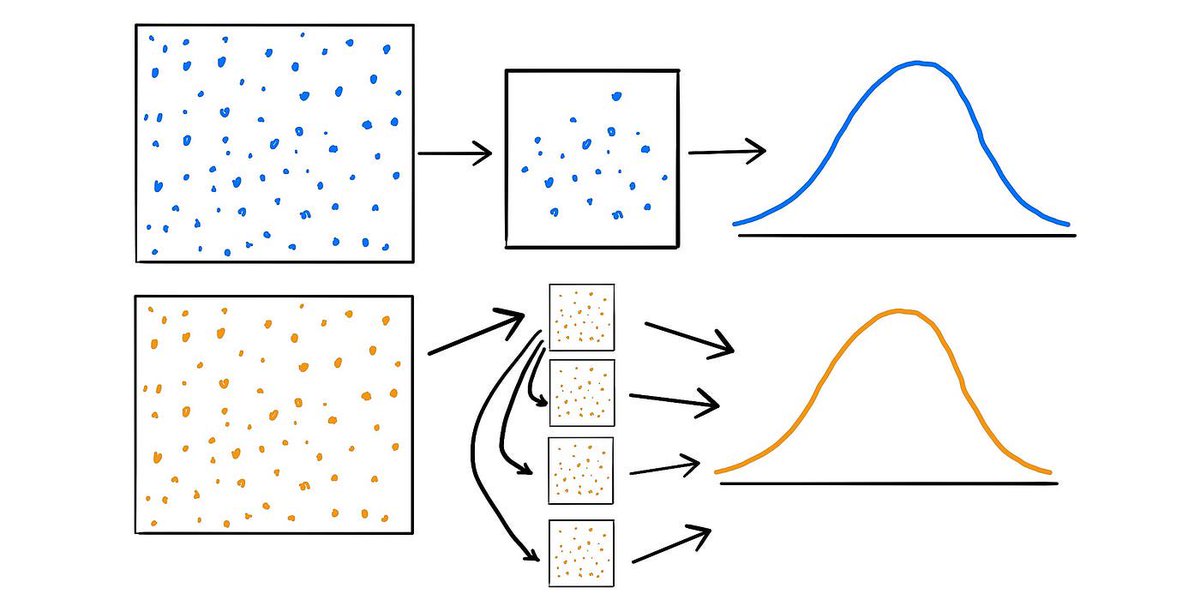
2/ 🥾 What's bootstrapping? It's a resampling technique where you take many subsamples from your sample data & analyze them. The idea? The subsamples give us an insight into the variability in our sample.
Jul 21, 2023 8 tweets 2 min read
🧵 Difference Between Confidence Interval & Credible Interval
1/ Intro
Both Confidence Intervals (CIs) and Credible Intervals (CrIs) provide a range for estimating an unknown parameter. But they're based on different philosophies and interpretations. #DataScience #Stats Image 2/ Confidence Interval (CI) 📉
•Based on frequentist statistics.
•If we were to repeat a study many times, ~95% (or another chosen level) of the CIs would contain the true parameter.
•It's about the intervals and their likelihood of capturing the true value.
Jul 21, 2023 10 tweets 2 min read
1/ 🧵 Let's dive into a common statistical question: When calculating standard deviation, why do we square the differences rather than taking their absolute value? Let's break this down. 📊 #DataScience #rstats Image 2/ Historical Context:
To start, the idea of squaring differences has a historical basis. Sir Francis Galton, a cousin of Charles Darwin, introduced it. Galton's work influenced the development of the variance (and subsequently the standard deviation).
Jul 19, 2023 10 tweets 2 min read
1/10 🧵 Dive into Data Visualization with #ggplot2! 📊
Let's explore the foundation of this popular #R package and how to create stunning plots using its components. Follow along! #DataScience #Rstats https://www.cedricscherer.com/2019/08/05/a-ggplot2-tutorial-for-beautiful-plotting-in-r/ 2/10 🖼️ The Canvas:
ggplot(data = your_data) creates the canvas. Every ggplot plot begins here. You're specifying the dataset you're working with. But just this alone won’t visualize anything! #RStats #DataScience
Jul 13, 2023 15 tweets 3 min read
1/15 🧵 Want to level up your #R programming skills? Whether you're a beginner or an intermediate R user, this thread is for you! Follow along for valuable tips, resources, and strategies to become a more confident and skilled R programmer. 🚀 #RStats #DataScience Image 2/15 R is a powerful language for data manipulation, analysis and visualization. To elevate your skills, start by understanding the language at its core. This includes the syntax, data types, vectors, matrices, lists, and data frames. #RStats
May 7, 2023 8 tweets 3 min read
1/ 📊📈 Let's dive into the fascinating world of #statistics and explore two key concepts: Odds Ratio and Relative Risk! Understanding the differences and applications of these two measures is crucial for interpreting study results and making informed decisions. #DataScience Image 2/ 🎲 Odds Ratio (OR): The Odds Ratio is a measure of association between an exposure and an outcome. It represents the odds of an event occurring in one group compared to the odds in another group. OR is particularly useful in case-control studies. #DataScience
May 7, 2023 9 tweets 3 min read
1/ 📊📏 Let's dive into the world of #statistics & explore the Levels of Measurement! Understanding these levels is crucial for choosing the right statistical methods for data analysis. Today, we'll cover the 4 main levels: Nominal, Ordinal, Interval, and Ratio. #DataScience Image 2/ 🏷️ Nominal Level: At this level, data is purely qualitative and categorical. There's no inherent order or ranking involved. Examples include colors, genders, or nationalities. It's important to note that mathematical operations like addition or subtraction don't apply here.
May 6, 2023 10 tweets 4 min read
🧵1/10: Systematic vs. Random Error 🎯

Welcome to this thread where we'll explore the differences between systematic and random error, two types of error that can impact the accuracy and precision of your data. Let's dive in! #Statistics #DataScience Image 🧵2/10: Error in Measurements 📏

In any measurement process, there's a possibility of errors occurring. Understanding the types of errors that can arise helps us to design experiments that minimize their impact and improve the quality of our results. #DataScience
May 5, 2023 8 tweets 4 min read
🧵1/8 🎲 Ever heard of the Monte Carlo Simulation?

It's a powerful mathematical technique used to model complex systems, make predictions, and optimize decision-making. Let's dive into this fascinating world! #MonteCarloSimulation #Statistics #DataScience 🧵2/8 How does it work? 🤔

Monte Carlo Simulation uses random sampling and statistical models to estimate unknown values. It simulates a system multiple times with different random inputs and aggregates the results to produce predictions. #RandomSampling #DataScience
Apr 28, 2023 10 tweets 7 min read
1/10: 🧪📊 Introducing Generalized Linear Models (GLMs) and how to perform them using R! A thread. #GLM #Rstats #DataScience Source: https://towardsdata... 2/10: 💡GLMs are a general class of regression models that extend linear regression, allowing for a variety of response distributions & link functions. They're used for modeling relationships between a response variable & one or more explanatory variables. #RStats #DataScience
Apr 27, 2023 10 tweets 7 min read
🧵1/10 Multivariate Normality: A Guide to Controlling It Using the MVN Package in R 📊
Multivariate normality is a key assumption in many statistical techniques. Let’s explore how to test and control for MVN using the MVN package in R. #rstats #DataScience
cran.r-project.org/web/packages/M… 🧵2/10 Installing the MVN Package 📦
First, let's install and load the MVN package in R:

install.packages("MVN")
library(MVN)

This package offers a range of functions to assess and visualize multivariate normality. #rstats #DataScience
Apr 27, 2023 16 tweets 12 min read
🧵1/16 🚀 Package Exploration! 🌌 We all know popular #RStats packages like ggplot2, dplyr, and shiny, but there are tons of hidden gems 💎 in the CRAN universe waiting to be discovered! Let's explore some lesser-known packages that can supercharge your #DataScience journey! Image 🧵2/16 🌈 colorfindr: This nifty package extracts the most common colors from your images! Whether you're working with visualizations, web design, or marketing materials, colorfindr has you covered. Check it out: cran.r-project.org/package=colorf… #RStats #DataScience
Apr 26, 2023 8 tweets 7 min read
[1/8] 📚 Introducing #Quarto: A Versatile, New and Exciting Publishing Tool! 🌟
Quarto is a powerful, open-source, and user-friendly publishing framework that streamlines the process of creating beautiful books, documents, and websites. Let’s explore it now!
#RStats #DataScience Image [2/8] 🤓 Language Agnostic: Quarto works seamlessly with multiple languages, including #Markdown, #LaTeX, #RMarkdown, and #Jupyter notebooks. So, whether you're a researcher or a creative writer, Quarto has you covered! 🌍
#DataScience #RStats
Apr 26, 2023 10 tweets 6 min read
🧵1/9 A deep dive into the history of #Backpropagation: A key technique in training multilayer architectures for neural networks. This powerful method revolutionized the way we train AI systems, leading to major breakthroughs in various domains. 🤖#DataScience #DeepLearning #AI Source: https://www.youtube... 🧵2/9 #Backpropagation is based on a simple concept: use gradient descent to optimize multilayer networks. By applying the chain rule for derivatives, it computes gradients efficiently, leading to optimized weight configurations in each layer of the network. #DataScience #AI