typerbole Profile picture
stacking stats | https://t.co/ejKbNgN8kO | https://t.co/JlCnypCY4p | https://t.co/CDx5M1zS5v | hyperbole with a t
Jan 2, 2021 11 tweets 4 min read
Many feel that this #Bitcoin market cycle is accelerating faster than 2017. As things heat up it's instructive to look back at past cycles to see how on-chain metrics moved and get some context into our current trajectory.

🧵with comparison charts 👇 1. Market Cap

If we index Market Cap to the value at each cycle's halving, we can see that this current cycle (2021) hit an inflection point up ~150 days after the halving.

The inflection point for 2017 was closer to 250 days post-halving, and for 2013 it was 50 days.

🚀🌽
Oct 27, 2020 10 tweets 6 min read
🚀 I built a new dashboard to track the health of the #Bitcoin ecosystem: bitcoinkpis.com

My goal is to help us focus on the metrics I believe are most likely to be correlated with Bitcoin’s success. It's a low time preference dashboard. 📈 Key features:
- 🔬 Focus on Bitcoin
- 📜 Historical data from multiple sources: on-chain, lightning, coinjoin, mempool, node count
- 🥃 Distilled to the most important trends for network and ecosystem success, rather than focus on number go up or trading
May 26, 2020 4 tweets 2 min read
New model: #Bitcoin block space price ($USD/vByte) as a function of $USD denominated on-chain transaction volume.

There is a nice positive relationship showing that block space price increases when demand for on-chain transactions increases. This is encouraging. 
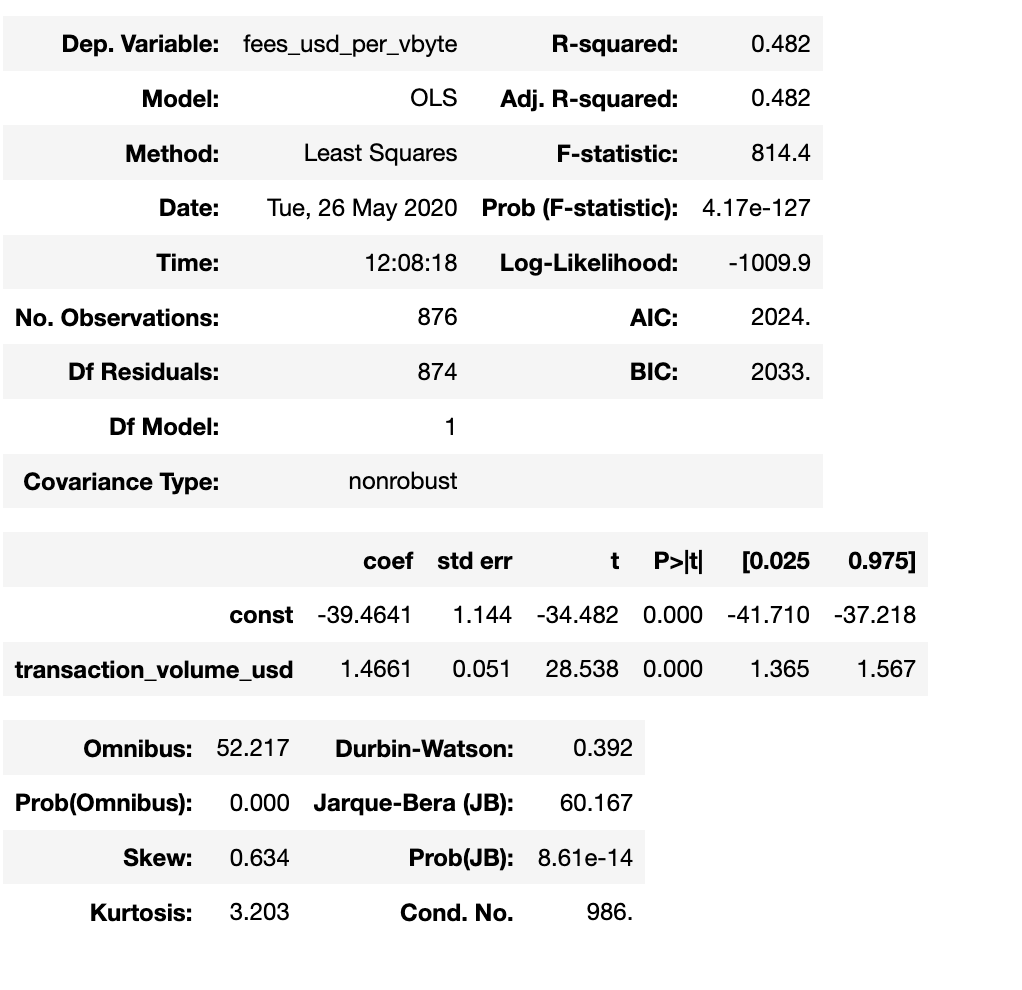
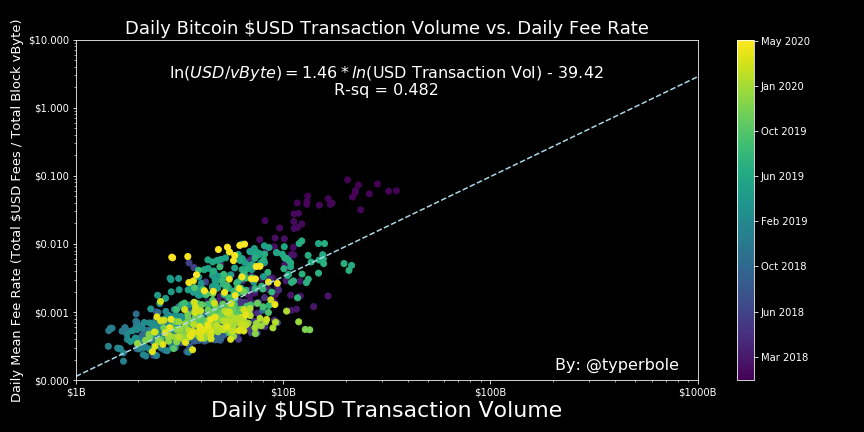
The current block space market has well-known inefficiencies (mostly participants who don't optimize transactions for low fees) which I think are reflected in this model, as the R-sq tells us that transaction demand only explains about half the block space price variation.