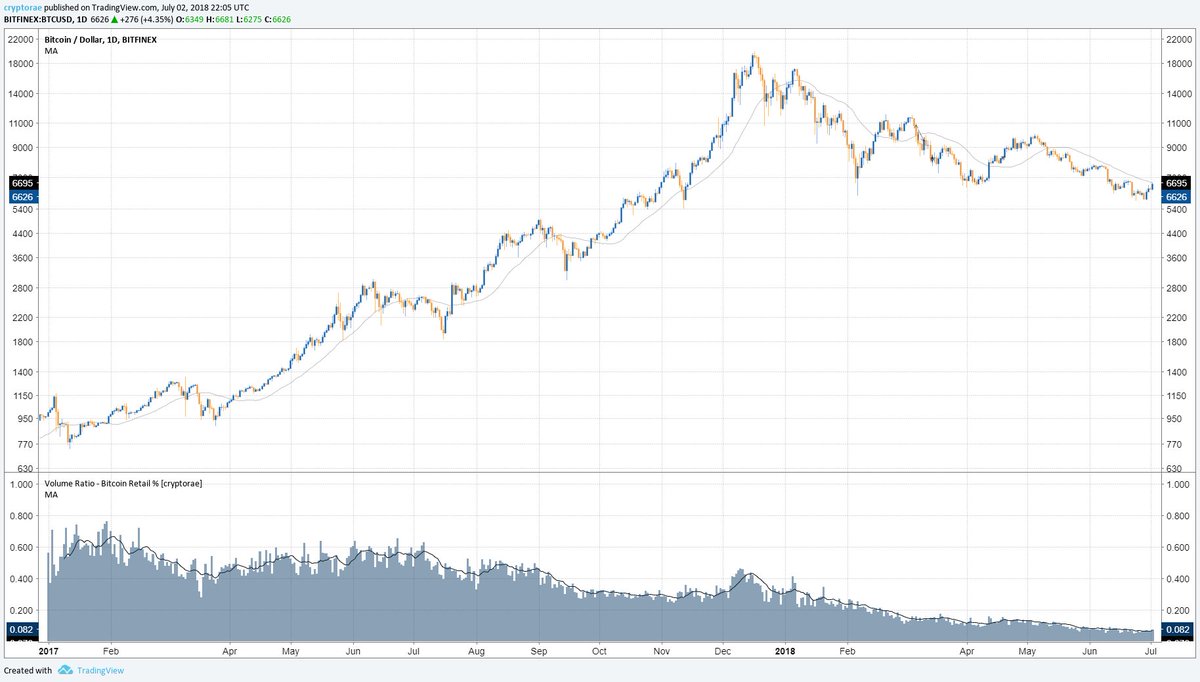
I updated my Retail Volume Share indicator on @tradingview with a couple minor tweaks to the exchanges. I'm threading in some thoughts and notes.
tradingview.com/script/zSkZhP1…
tradingview.com/script/zSkZhP1…
https://twitter.com/cryptorae/status/1013935532747862017
Changes:
1. Removed Bithumb data due their distortive wash trading event. [1]
2. Added Gemini data now that they have backfilled their volume data on TradingView.
[1]
1. Removed Bithumb data due their distortive wash trading event. [1]
2. Added Gemini data now that they have backfilled their volume data on TradingView.
[1]
https://twitter.com/loomdart/status/1036236801634172933
Comparison of v1 and v2. Removing Bithumb has cleaned the noise up a lot. (I'm not happy about removing Bithumb volume from this indicator b/c Korea is such a strong retail market. I'll consider adding it back later when the noise clears.) 
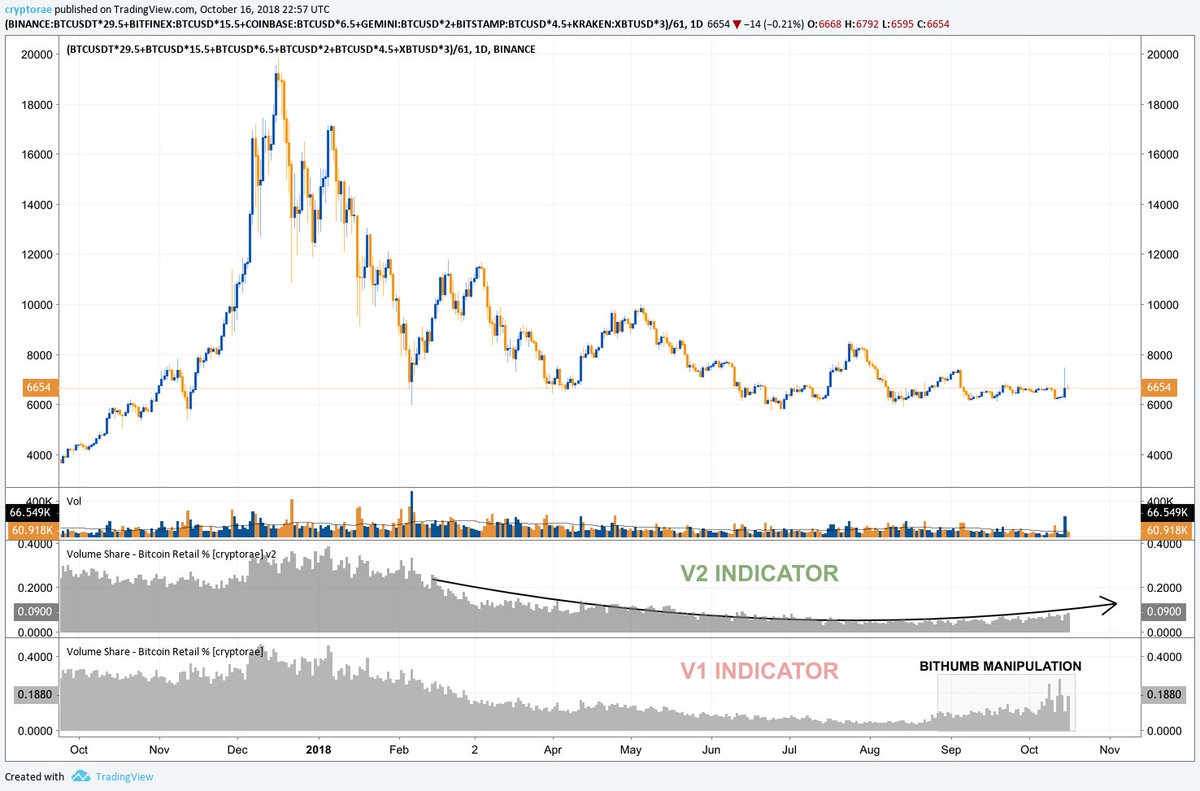
The retail share of the market is slowly creeping back up. This development can largely be attributed to the decline of volume on BitMEX, which is currently a graveyard of degen-class traders who are the collateral damage of the pro vs. pro wars.
MEX volume declining:
MEX volume declining:
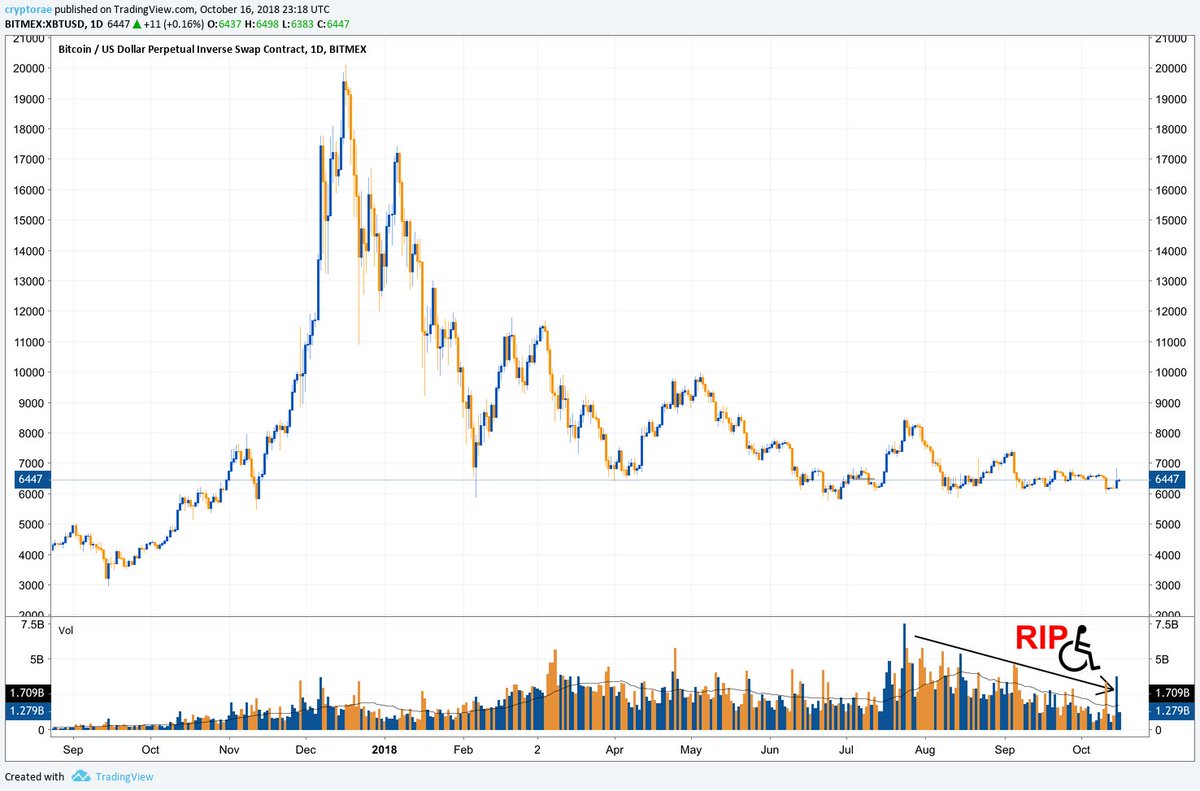
Don't get too excited. The slight upward drift of retail volume share is not due to positive retail sentiment, but due to degen exhaustion. I view this as a positive (not necessarily bullish) development.
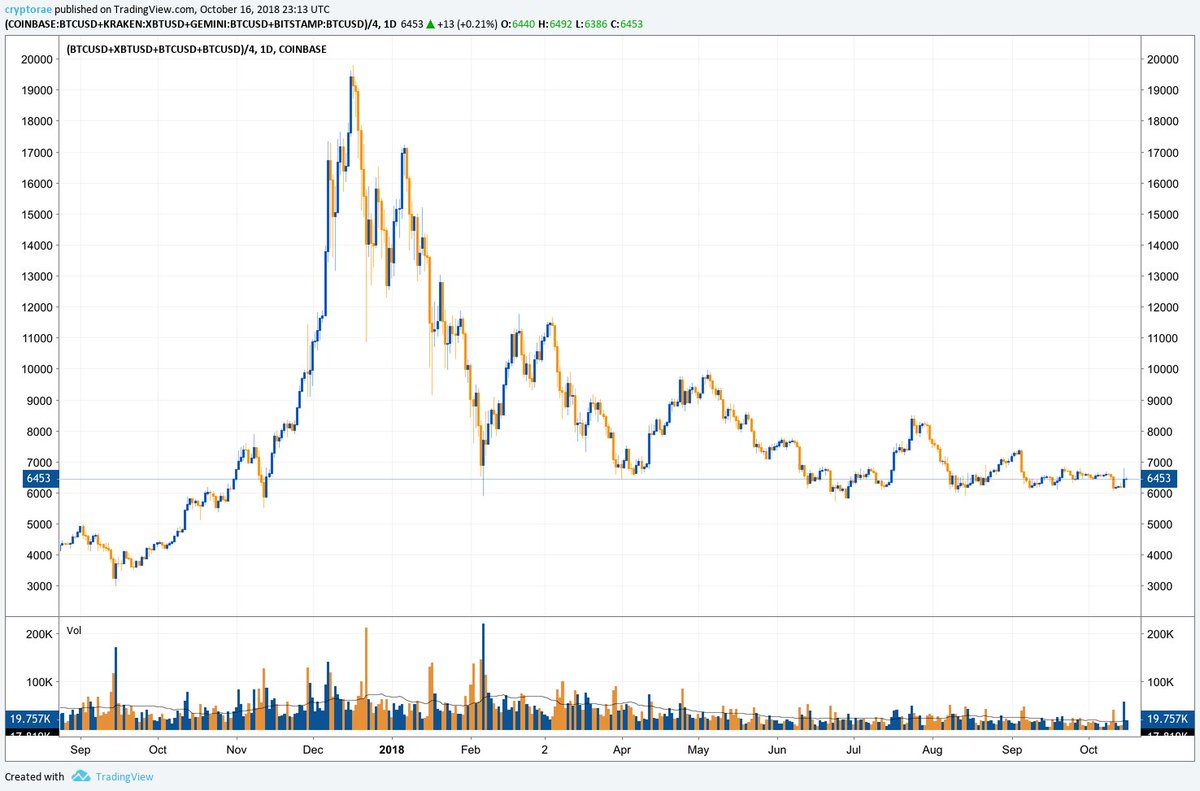
Fiat onramp volume flat:
Fiat onramp volume flat:
The rise in retail volume share represents a sort of trader capitulation. Traders must learn to cope with boredom and effectively allocate their time. If these markets bore you, walk away form it. Your mind is decaying by constantly scrutinizing these charts. Get some sunlight.
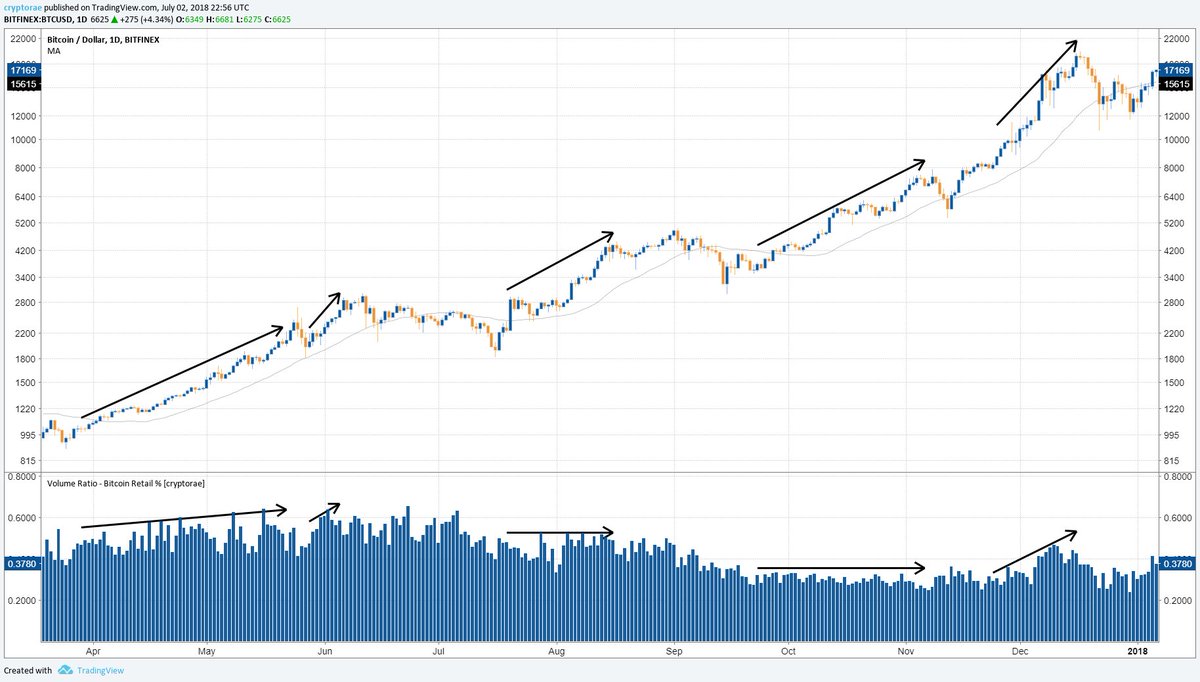
I continue to believe the same things asserted in my prior thread (tl;dr that increasing retail participation would confirm a break out of local highs AND lows on the chart. Decreasing retail participation would invalidate those break outs.) Remember, this is just a *theory*.
What's next: The R/R of short selling is poor right now as we appear to have bottomed. That said, you should remember that retail volume share is not a one-way measure of bullishness. Volume share should also rise if we are to see a true, sell-it-all-to-cash capitulation.
This continues to be my favorite macro indicator for crypto markets and real-time gauge of sentiment, which is the single most important driver of prices. I leave it on every chart. I hope you find it equally useful and I appreciate feedback and additional interpretation.
NOTE:
1. Intra-period volume-share levels can greatly fluctuate. You must wait for a candle before interpreting the most recent data point of the indicator.
2. If the indicator is already on your TV chart, you must remove it and re-add it to see the updated version
1. Intra-period volume-share levels can greatly fluctuate. You must wait for a candle before interpreting the most recent data point of the indicator.
2. If the indicator is already on your TV chart, you must remove it and re-add it to see the updated version
• • •
Missing some Tweet in this thread? You can try to
force a refresh