⚠️TRIGGER WARNING...BIG TIME: In light of the recent horrific developments in Georgia, Ohio, Alabama and other GOP-run states, it’s time once again to remember that Republican ignorance of, cruelty about and obsession with all things rape-related has been a thing for decades. 1/
I therefore am once again taking you down memory lane, with a few case studies from the Republican Rape Advisory Chart:
goprapeadvisorychart.com 2/
1988: Republican State Representative Stephen Freind of Pennsylvania. 3/
1990: Republican Gubernatorial candidate Clayton Williams of Texas: 4/
1995: Republican state representative Henry Aldridge of North Carolina. 5/
1998: Republican state Senator & U.S. Senate candidate Fay Boozman of Arkansas. 6/
2002: Republican state senate candidate Dick Black of Virginia. 7/
2003: Republican Governor Jen Bush of Florida. 8/
2005: Republican state representative Mark Anderson of Arizona. 9/
2005: Republican state representative Wards Nichols of Arizona. 10/
2006: Republican Senate candidate Ken Buck of Colorado. 11/
2006: Republican state representative Bill Napoli of South Dakota. 12/
2008: Republican state representative Jonathan Strickland of Texas. 13/
2010: Republican Senate candidate Sharron Angle of Nevada. 14/
2010: Republican Congressman Steve King of Iowa. 15/
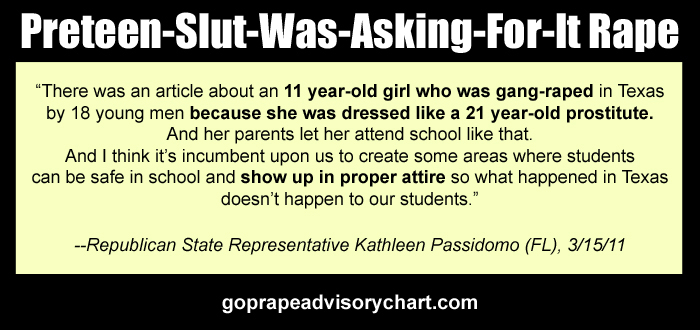
2011: Republican state representative Kathleen Passidomo of Florida. 16/
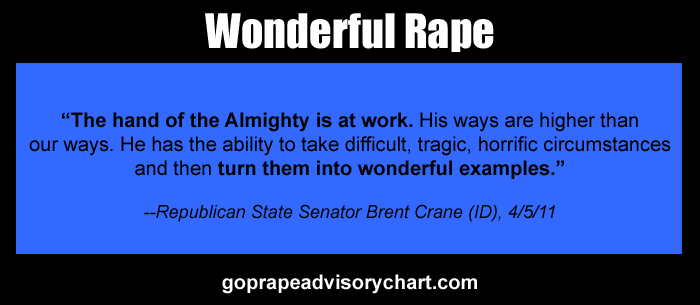
2011: Republican state senator Brent Crane of Idaho. 17/
2011: Republican state representative Pete DeGraaf of Kansas. 18/
2011: Republican Governor and Presidential candidate Bobby Jindal of Louisiana. 19/
2011: Republican state representative Roger Rivard of Wisconsin. 20/
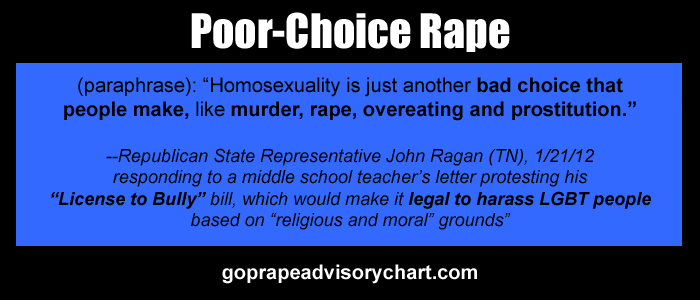
2012: Republican state representative John Ragan of Tennessee. 21/
2012: Republican Senator and Presidential candidate Rick Santorum of Pennsylvania. 22/
2012: Republican Congressman and Presidential candidate Ron Paul of Texas. 23/
2012: Republican state Senator Chuck Winder of Idaho. 24/
2012: Republican Senate candidate Tom Smith of Pennsylvania. 25/
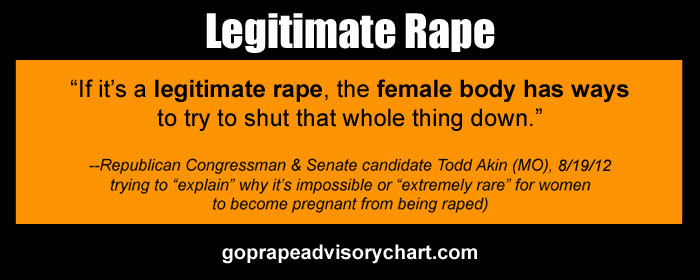
2012: Republican Congressman and Senate candidate Todd Akin of Missouri (he was the "inspiration" for my decision to start tracking these statements). 26/
I'll stop for now.
Note that I'm only up to 2012.
I added over SEVENTY MORE to the archive over the next 4 years before becoming too sickened to continue after Donald Trump was elected President.

You can view them all, with source links, here: goprapeadvisorychart.com

• • •

Missing some Tweet in this thread? You can try to force a refresh
 

Keep Current with Charles #GetCovered-ba 🩺

Charles #GetCovered-ba 🩺 Profile picture

Stay in touch and get notified when new unrolls are available from this author!

Read all threads

This Thread may be Removed Anytime!

PDF

Twitter may remove this content at anytime! Save it as PDF for later use!

Try unrolling a thread yourself!

how to unroll video
  1. Follow @ThreadReaderApp to mention us!

  2. From a Twitter thread mention us with a keyword "unroll"
@threadreaderapp unroll

Practice here first or read more on our help page!

More from @charles_gaba

Feb 21
📣⚠️ NEW: As I've been expecting for over a month and as I hinted at last week, the Red/Blue COVID death rate divide, which had been significantly reduced during the #Omicron wave, has started moving back up again:
acasignups.net/22/02/21/weekl…
There was one point in late September when the daily COVID death rate in the reddest decile of the U.S. was running nearly NINE TIMES HIGHER than in the bluest decile.

The gap between the extremes shrank down to almost nothing by late January...but is moving back up again now.
No idea how long this upswing will last & I doubt it will ever reach the extremes of the Delta wave...but the reason is pretty clear: Omicron, like prior variants, hit the most densely populated urban (blue) areas hard first, but is now spreading out into the rural (red) areas.
Read 4 tweets
Feb 21
📣 WEEKLY UPDATE: County-level COVID vaccination rates by 2020 partisan lean:
acasignups.net/22/02/21/weekl…
⚠️ AMERICA IN ONE IMAGE, updated thru today: Image
--There's now 13 U.S. counties w/694K residents where over 90% of their total populations have received their 2nd shot.

--There's 50 counties w/16.5M residents where over 80% have gotten a 2nd shot.

--There's 204 counties w/79.5M residents where over 70% have gotten a 2nd shot.
Read 6 tweets
Feb 20
Well, for starters, this is comparing the entire state of Florida (including the vast rural counties) against the CITY of New York (one of the most densely-populated areas of the country).
At a MINIMUM you’d have to compare the STATE of NY (roughly 20M) vs the STATE of Florida. Also, I don’t think he wants me to compare the states from last September, for instance.
Here's NYC *plus* the rest of NY STATE (they're listed separately).

Jan 2021: 6,293 deaths
Jan 2022: 5,506 deaths
= 12.5% *fewer* deaths statewide in NY in Jan 2022 vs. Jan 2021.

A smaller drop than FL's 33.5% drop, sure...but a hell of a lot different from a 32% *increase*.
Read 8 tweets
Feb 19
Been feeling kind of crappy the past few days so I decided to go ahead and use one of the 4 at-home COVID tests we received via USPS. My wife, kid & I are all vaxxed/boosted but you never know these days...

Will have the results in another 8 minutes or so.
Re. the test itself, for those who haven't used an at-home one yet: It's not too bad/complicated, but the nasal swab part is much worse than a PCR test--instead of 1 nostril for 5 seconds, you have to swab *both* nostrils for *15* seconds each.

Much sneezing resulted.
Annnnd…it’s negative.
Which means either a) I don’t have COVID, b) I did something wrong, or c) it’s a false negative. Image
Read 5 tweets
Feb 8
📣 (warning: long thread w/50+ graphics)

It's been another 3 months, so I figured it's a good time to again break out COVID county-level, 2-dose, total population vaccination rates for all 50 states.

Again, I use CDC data for most states, w/state health dept. data for a few. 1/
ALABAMA: Fairly weak partisan correlation, mainly because the vaccination rate sucks pretty much EVERYWHERE. It does form an odd snake shape, though.

The graph on the right (w/out background graphics/etc) includes children 5-11 only.
ALASKA: AK has always been all over the place on COVID vaccination rates. Bristol Bay has supposedly vaxxed *over* 100% of its population which is impossible; this is caused by a variety of factors including error margin etc. I've set a max cap of 98% for any county's vaxx rate.
Read 51 tweets
Feb 7
@RachelBitecofer Well, I haven't looked at 5-11 specifically, but it's pretty clear here. Notice how *both* the R^2 (correlation) *and* slope stopped climbing/leveled off around September, stayed flat for 2 months, and then started climbing again right after Thanksgiving?
@RachelBitecofer Guess what happened right around Thanksgiving?

Hypothesis: For the most part, mostly-Dem vaxxed parents vaxxed their kids; mostly-GOP unvaxxed parents refused to vaxx their kids.
Read 5 tweets

Did Thread Reader help you today?

Support us! We are indie developers!


This site is made by just two indie developers on a laptop doing marketing, support and development! Read more about the story.

Become a Premium Member ($3/month or $30/year) and get exclusive features!

Become Premium

Don't want to be a Premium member but still want to support us?

Make a small donation by buying us coffee ($5) or help with server cost ($10)

Donate via Paypal

Or Donate anonymously using crypto!

Ethereum

0xfe58350B80634f60Fa6Dc149a72b4DFbc17D341E copy

Bitcoin

3ATGMxNzCUFzxpMCHL5sWSt4DVtS8UqXpi copy

Thank you for your support!

Follow Us on Twitter!

:(