Why is Nifty not able to break down? Look at the charts and the yellow parallel line. This range has been very important since the last 10 years... The yellow range breakdown can trigger a bear market and the red line breakdown even worse.. RT and share this learning..
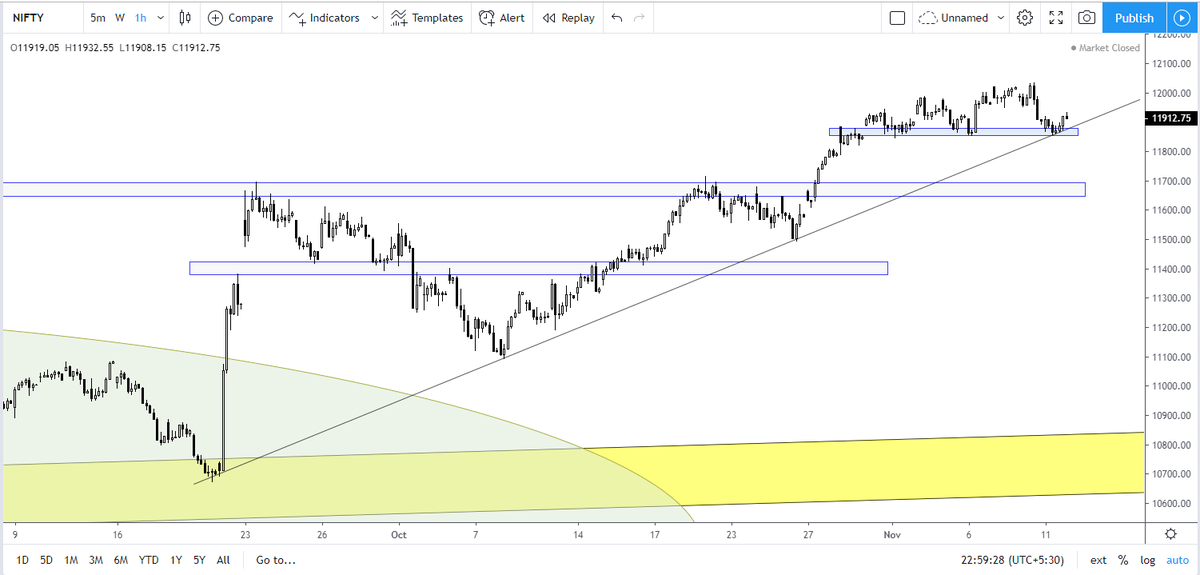
Nifty hourly charts! Until this upward sloping line holds, we should hit all-time highs soon.. If the line gives away, expecting at least 50% retracement... @nifty#hourlycharts#trading#trendlines
Nifty Monthly chart update - This is the chart of Nifty in the last 15 years and I don't see a bear market in Nifty until and unless Nifty breaks below the red line, though we already had a bad small-cap and mid-cap bear market already ;)
Nifty - parallel orange chart in expanded mode. We are at an important support zone, which if not respected can lead to another 600-700 point fall to 10900-950 levels. Watch the price action above and below the red line to understand. #Nifty#trendlines#trading
But a major bear market will trigger only when the upward sloping thick red line breaks, which will take a monumental selling effort. Again, see the price action behaviour in the chart to learn price action. #Nifty#trading#trendlines#Monthlycharts
• • •
Missing some Tweet in this thread? You can try to
force a refresh
It took me 10+ years & more than 1000+ hours of practice…
to master these 5 IMPORTANT RULES WHILE DRAWING TRENDLINES 🎯
These simple rules, if mastered, can help one spot HIGH PROBABILITY TRADES!
Ready to learn?🤓
Let’s go🧵…
1⃣ Trendlines are zones and not a single line!
- Due to volatility in price, many times prices tend to spike on both sides
- So, consider trendlines as zones from multiple swing highs(include wicks) to get the best fit trendline
- Your winning probability increases with zones
2⃣ Trendlines with more touchpoints
- Any trendline with 3 or more touchpoints is a very significant one
- The price points around significant trendlines are important & should be watched
Master the art of trend reversal patterns & protect your hard-earned money!🤓
In this thread, you will learn...
3⃣ Types of TOP REVERSAL PATTERNS...
...that will signal a change in the direction of the existing or predominant uptrend!
Let's go...🧵
Before we start, If you are person who enjoys watching videos for a detailed explanation you can watch this video where I explain everything...
Else, read on... 📚
1⃣ Failure Swing
- Price makes a high & then the next high fails to cross the previous high
- Price now breaks the swing low between the two highs thus signalling a potential sell
- This sell signal indicates a potential change in trend
It took me 1000+ hours of practice to...
...learn how to NAVIGATE FALSE BREAKOUTS🎯
In this 🧵, I will be sharing 6 techniques...
...as to how I try to avoid getting CAUGHT & LOSING MONEY💰 trading breakouts
Ready to learn?🤓
Let’s go🧵…
1⃣ Cardinal rule: Stop chasing breakouts...
- If everyone is talking about it on social media and it has already broken out
- If a stock has moved up already for the last few days
- If a stock is up more than 10% already from breakout zone
- If your SL is deep
2⃣ Enter only on breakout & nowhere else if you're trading breakouts...
Buy only…
- above breakout zones (no entry in no-man land)
- above a key resistance zone after a stock consolidates
- 1-2% above resistance zone
- Identify entry points(set alerts on TV/set GTT in zerodha)