The double Ds - demographic & debt - & how that leads to the triple Ds - DEFLATION.
Ready?
Ready?
#demographics World population growth rates are expected to slow, w/ contraction in many places (think Europe, East Asia - Japan, China, South Korea, etc).
We will grow at the slowest pace than anytime since 1950. Growth rate peaked in 1965-1970 👈🏻
We will grow at the slowest pace than anytime since 1950. Growth rate peaked in 1965-1970 👈🏻

#demographics Breaking this down into regions - very clear that Asian population peaking & will fall.
Look at Sub-Saharan Africa. Note that this is a projection & we shouldn't take anything beyond 2050 too seriously. The UN revises this very often but still useful for trends.
Look at Sub-Saharan Africa. Note that this is a projection & we shouldn't take anything beyond 2050 too seriously. The UN revises this very often but still useful for trends.

#demographics Let's look at contribution to population growth by country. Ready?
#1 India 🇮🇳
#2 Nigeria 🇳🇬
#3 Pakistan 🇵🇰
#4 Congo 🇨🇬
#5 Ethiopia 🇪🇹
#6 Tanzania 🇹🇿
#7 Indonesia 🇮🇩
#8 Egypt 🇪🇬
#10 USA 🇺🇸
#1 India 🇮🇳
#2 Nigeria 🇳🇬
#3 Pakistan 🇵🇰
#4 Congo 🇨🇬
#5 Ethiopia 🇪🇹
#6 Tanzania 🇹🇿
#7 Indonesia 🇮🇩
#8 Egypt 🇪🇬
#10 USA 🇺🇸

#demographics Most populous country by rankings from 1999 to 2050 (2100 is a bit far away here). By 2050:
#1 India 🇮🇳
#2 China 🇨🇳
#3 Nigeria 🇳🇬
#4 USA 🇺🇸
China population expected to decline while US still increases. Indonesia drops out of fourth place 😱
#1 India 🇮🇳
#2 China 🇨🇳
#3 Nigeria 🇳🇬
#4 USA 🇺🇸
China population expected to decline while US still increases. Indonesia drops out of fourth place 😱

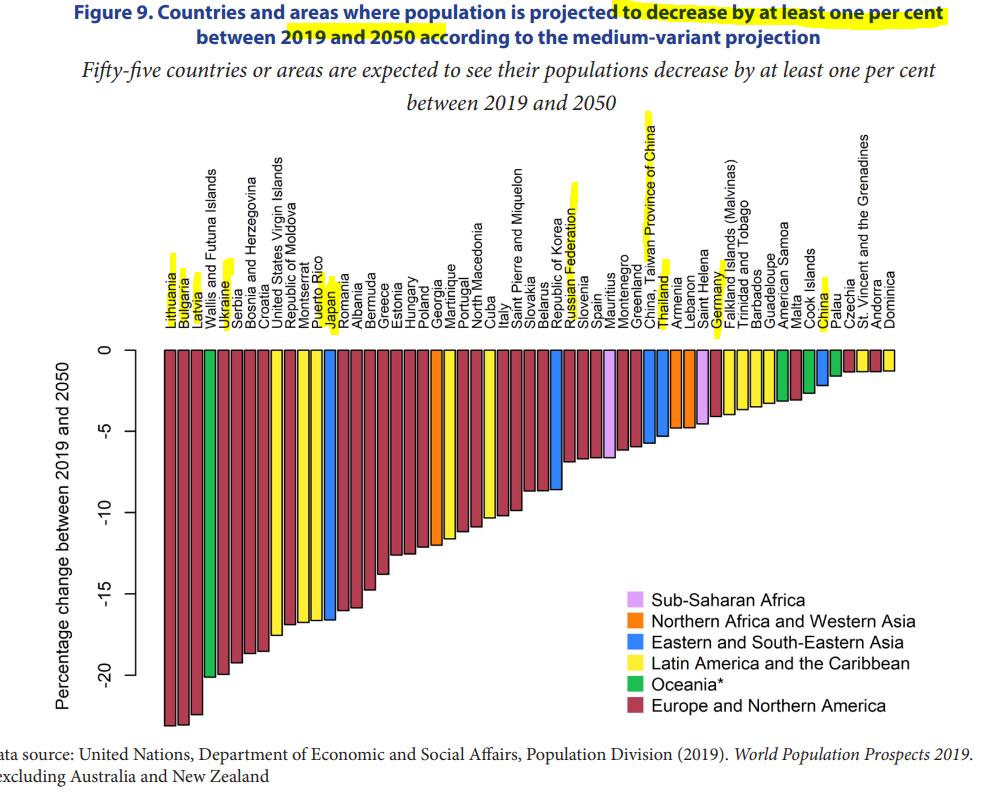
#demographics Countries where population will DECLINE by at least 1% b/n 2019 & 2050. Ready?
>-20% decline is full of European countries
>-15% is Japan 🇯🇵 - Japanese people becoming rare
>-5% Russia, Taiwan, Thailand - also becoming rarer
>-2% China 🇨🇳 👈🏻
USA not there !
>-20% decline is full of European countries
>-15% is Japan 🇯🇵 - Japanese people becoming rare
>-5% Russia, Taiwan, Thailand - also becoming rarer
>-2% China 🇨🇳 👈🏻
USA not there !
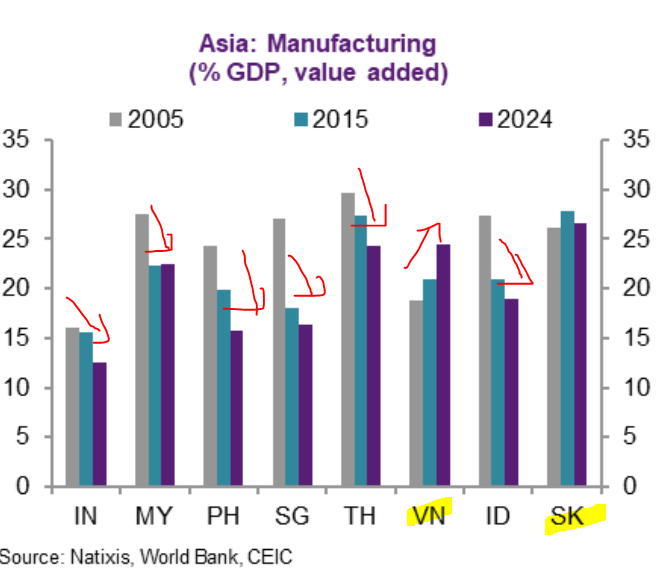
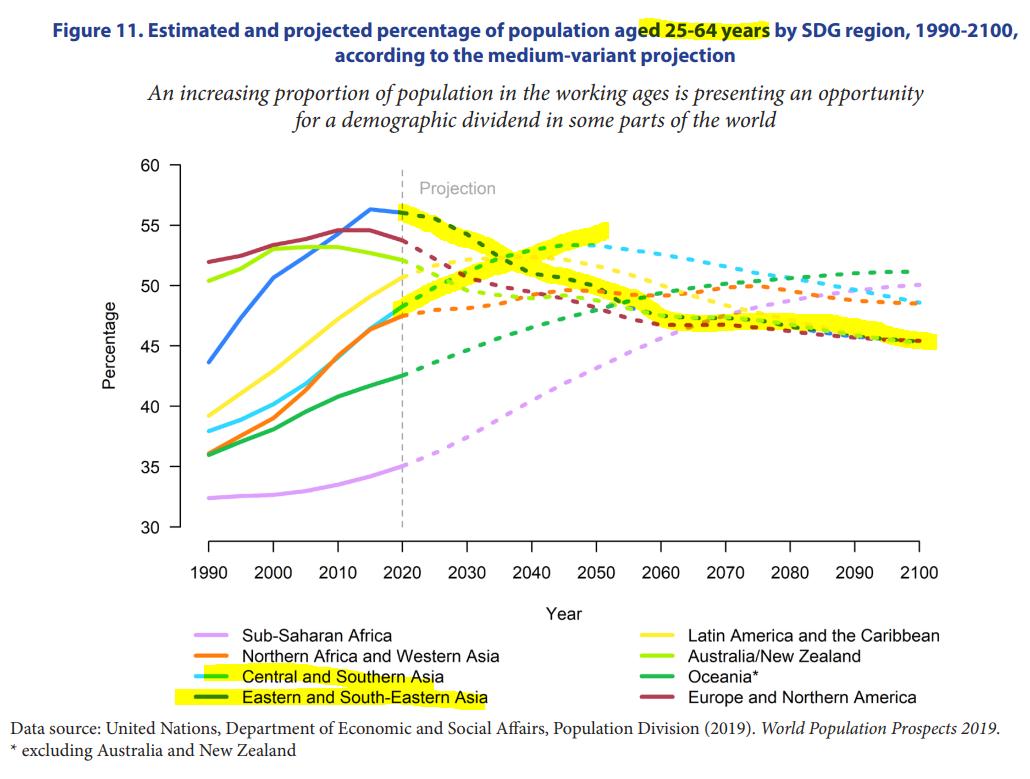
#demographics This is the mother of all charts b/c economists care about working age population to see if the change of labor will be helpful or a drag to growth. In East Asia, that will FALL SHARPLY.
In South Asia, that will RISE. A complete juxtaposition.
In South Asia, that will RISE. A complete juxtaposition.
#demographics Once upon a time in 1990, the world was very youthful. Not too many >65-year old around (life expectancy lower). Only the UK & Nordic countries had >15% of population >65.
Today, everyone has aged & made fewer babies & so silvering. By 2050, on Africa is young 👇🏻🌍
Today, everyone has aged & made fewer babies & so silvering. By 2050, on Africa is young 👇🏻🌍

#demographics We are not replacing ourselves fast enough in Asia (not South Asia however) & Europe. Why? Not having enough babies. Speaking of which, I was obsessed about Archie the royal baby last night - only 1 though, need 1 more to replace both parents.
Birth below 2 👇🏻👇🏻👇🏻
Birth below 2 👇🏻👇🏻👇🏻

#demographics We are living longer (80s👵🏻🥳) & expected to live longer - so treat your body well as u have to see it for a while. Anyway, not good news if u work for a pension fund or social security office. Haha.
Oh wells. Long silvering stocks?🤷🏻♀️
Oh wells. Long silvering stocks?🤷🏻♀️

#demographics People voting with their feet? Net international migration during 2010 to 2020.
Look at the USA 🇺🇸 - off the chart!!! A lot of net + migration (I moved to HK in 2011 so -1). Germany big too.
Who sees net outflows? India & China. Also Venezuela. Biggest is Syria!
Look at the USA 🇺🇸 - off the chart!!! A lot of net + migration (I moved to HK in 2011 so -1). Germany big too.
Who sees net outflows? India & China. Also Venezuela. Biggest is Syria!

#demographics This chart is just so heart-breaking for Russia & Italy & good for the USA & the Americas in general & Australia too!
Okay, so if u got net +inflows of people & net +natural increase (births>deaths) = HOT PINK (e.g., 🇺🇸🦘🇦🇺)
If deaths>births and net outflow = BLUE
Okay, so if u got net +inflows of people & net +natural increase (births>deaths) = HOT PINK (e.g., 🇺🇸🦘🇦🇺)
If deaths>births and net outflow = BLUE

All about #demographics 👇🏻👇🏻👇🏻 - they got statistics too on urbanization etc. Free to download. Have fun!
population.un.org/wpp/Publicatio…
Okay, #debt - the fun stuff! This is the @BIS_org turf. The quarterly bulletin! @HyunSongShin - my fav economist 🤓
bis.org/publ/qtrpdf/r_…
population.un.org/wpp/Publicatio…
Okay, #debt - the fun stuff! This is the @BIS_org turf. The quarterly bulletin! @HyunSongShin - my fav economist 🤓
bis.org/publ/qtrpdf/r_…
@BIS_org @HyunSongShin #debt We know that debt is not the issue b/c that is asset on the other side of the balance sheet.
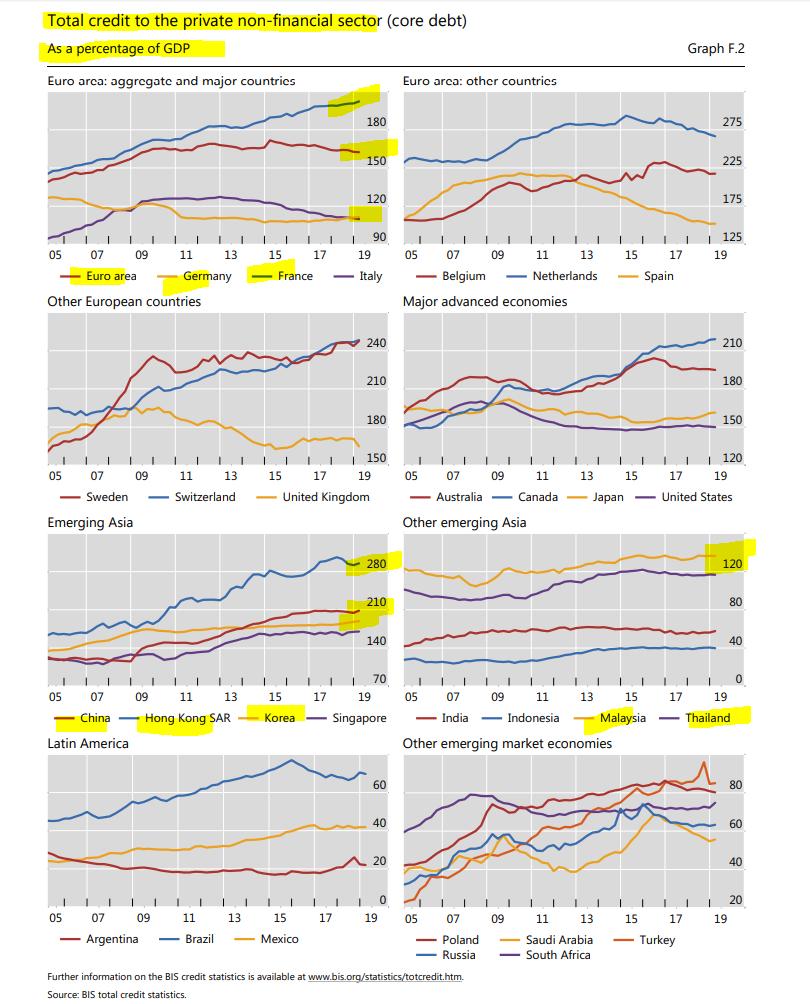
But debt can be debilitating if income can't grow faster than the debt. Economists look at debt as a percentage share of income. At the macro level, % of GDP
Private debt % GDP👇🏻
But debt can be debilitating if income can't grow faster than the debt. Economists look at debt as a percentage share of income. At the macro level, % of GDP
Private debt % GDP👇🏻

@BIS_org @HyunSongShin Let's step back & think about this for a second for those not in finance. Say your annual income = 100. But u don't want to stay at 100, u want to grow to say 200 in 10yrs & so u borrow $ & hopefully invest to upskill & not consume &that ur new skills gets u to say 200 salary. OK

@BIS_org @HyunSongShin When u take on debt, u make 2 assumptions: a) the investment will payoff in making you more productive (rise in income); b) interest expense + payment sustainable.
So u have a problem if: a) income declines; b) interest expenses rise; c) debt too high & principal payment rise👈🏻
So u have a problem if: a) income declines; b) interest expenses rise; c) debt too high & principal payment rise👈🏻

@BIS_org @HyunSongShin Let's look at the situation & assume that all these economies make 100 per year. In the Euro area, private debt is ~160; Off the chart in Sweden at 240.
In EM Asia, China private sector debt is 210 for 100 income, Korea ~150, Malaysia >120, Thailand ~120
India & Indonesia low
In EM Asia, China private sector debt is 210 for 100 income, Korea ~150, Malaysia >120, Thailand ~120
India & Indonesia low
@BIS_org @HyunSongShin This is what we call the STOCK of private sector debt. When you have a lot of debt & the debt is greater than your current income, 2 other elements are important:
Time horizon to repay the debt & interest expense on the debt (how fast it compounds relative to ur income) 👈🏻👈🏻👈🏻
Time horizon to repay the debt & interest expense on the debt (how fast it compounds relative to ur income) 👈🏻👈🏻👈🏻
@BIS_org @HyunSongShin If the term of debt is SHORT-TERM, u're in a pretty hurry to pay it back, which is basically a lot of China's private sector debt. So u're constantly needing to roll over this debt as it EXCEEDS income.
When this happens, if ur income growth is weakening, u'd want RATES TO FALL
When this happens, if ur income growth is weakening, u'd want RATES TO FALL
@BIS_org @HyunSongShin Ur risk appetite to take on debt's contingent upon expectation of higher return or paying this back won't destroy ur future well being (economists call this smoothing consumption as u're rational). If profits fall, rates sticky, expectations of future worse, have a flow issue too

@BIS_org @HyunSongShin This goes back to @michaelxpettis tweet yesterday on it is not a supply but a demand issue in China. I think it is both. When a system is too leveraged, it only make sense to increase risk if the reward of that risk is big enough as debt payment burden high already.
Debt 👇🏻
Debt 👇🏻

@BIS_org @HyunSongShin @michaelxpettis What's going on with growth? Globally, in places where demographic challenges are massive (Europe, Japan, Korea, China) & debt is high (same group), there is a growth problem. This is esp an issue if a country like the US is less willing than before to be consumer of last resort.
@BIS_org @HyunSongShin @michaelxpettis So demographic (adverse transition) + debt (debt as a share of GDP>2 times) = Weaker growth.
But do not underestimate central banks' resolve to fight this pull. How? Lowering interest rates. Japan. Europe. Korea. and China too when it has space to do so once it sorts out protein
But do not underestimate central banks' resolve to fight this pull. How? Lowering interest rates. Japan. Europe. Korea. and China too when it has space to do so once it sorts out protein
@BIS_org @HyunSongShin @michaelxpettis In all scenarios of the World Bank's long-term projection, China growth will decelerate below 6% 👇🏻👇🏻👇🏻

@BIS_org @HyunSongShin @michaelxpettis Today, the Bank of Korea raised its concern regarding the STOCK of debt Korea has & the deterioration of earnings (exports in double digits contraction) on the repayment ability, although says still OK so far. That said, Korean households debt/disposable income is 159%.
👇🏻👇🏻👇🏻
👇🏻👇🏻👇🏻

• • •
Missing some Tweet in this thread? You can try to
force a refresh